New Zealander vs Immigrants from Northern Africa In Labor Force | Age 20-24
COMPARE
New Zealander
Immigrants from Northern Africa
In Labor Force | Age 20-24
In Labor Force | Age 20-24 Comparison
New Zealanders
Immigrants from Northern Africa
75.2%
IN LABOR FORCE | AGE 20-24
65.4/ 100
METRIC RATING
161st/ 347
METRIC RANK
74.6%
IN LABOR FORCE | AGE 20-24
17.9/ 100
METRIC RATING
203rd/ 347
METRIC RANK
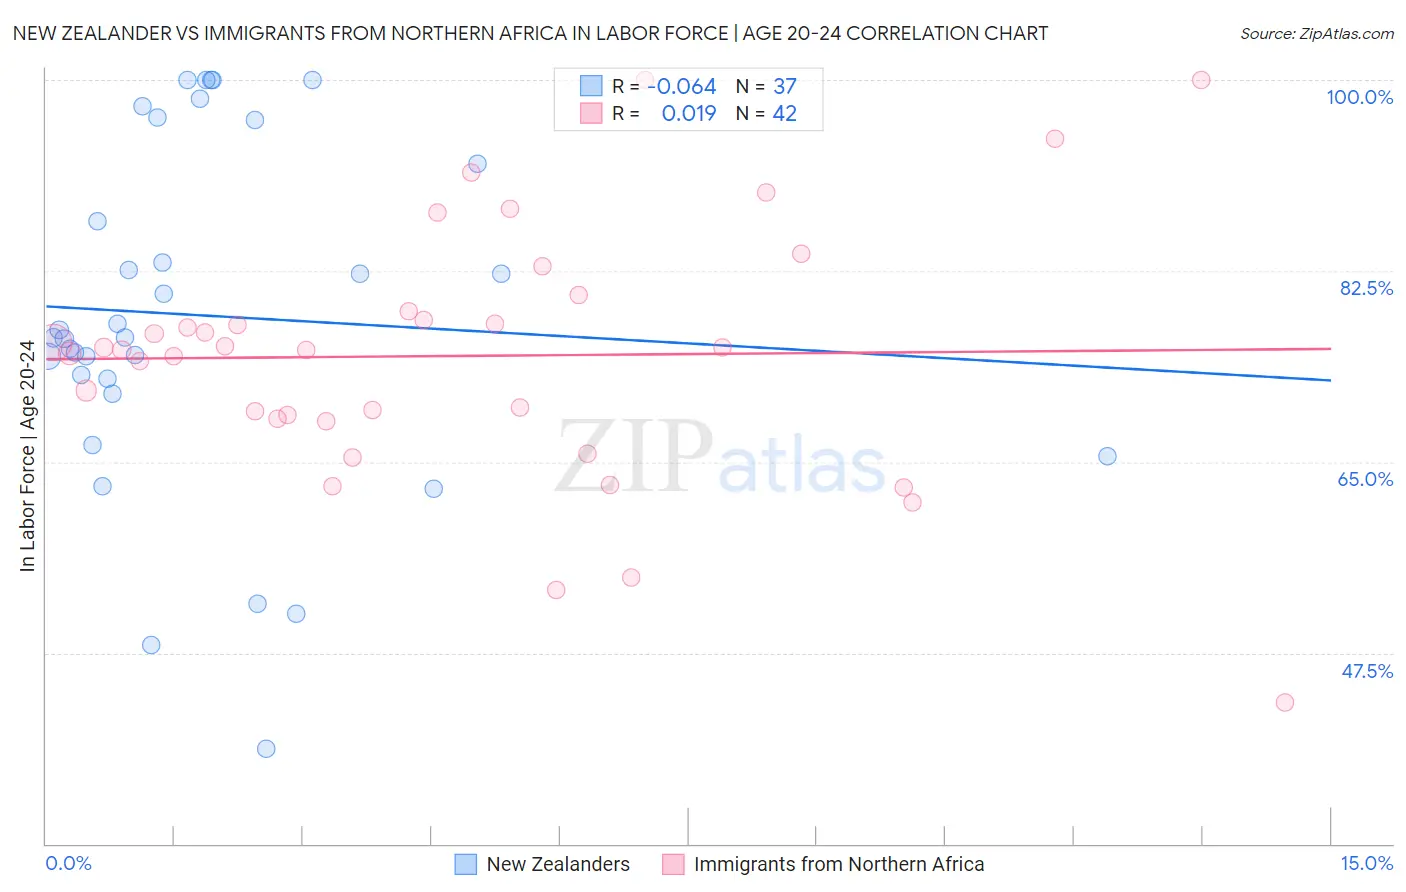
New Zealander vs Immigrants from Northern Africa In Labor Force | Age 20-24 Correlation Chart
The statistical analysis conducted on geographies consisting of 106,909,233 people shows a slight negative correlation between the proportion of New Zealanders and labor force participation rate among population between the ages 20 and 24 in the United States with a correlation coefficient (R) of -0.064 and weighted average of 75.2%. Similarly, the statistical analysis conducted on geographies consisting of 321,123,138 people shows no correlation between the proportion of Immigrants from Northern Africa and labor force participation rate among population between the ages 20 and 24 in the United States with a correlation coefficient (R) of 0.019 and weighted average of 74.6%, a difference of 0.80%.
In Labor Force | Age 20-24 Correlation Summary
| Measurement | New Zealander | Immigrants from Northern Africa |
| Minimum | 38.7% | 42.9% |
| Maximum | 100.0% | 100.0% |
| Range | 61.3% | 57.1% |
| Mean | 78.4% | 74.7% |
| Median | 76.4% | 75.4% |
| Interquartile 25% (IQ1) | 71.9% | 69.0% |
| Interquartile 75% (IQ3) | 94.3% | 78.8% |
| Interquartile Range (IQR) | 22.4% | 9.8% |
| Standard Deviation (Sample) | 15.8% | 11.7% |
| Standard Deviation (Population) | 15.6% | 11.6% |
Similar Demographics by In Labor Force | Age 20-24
Demographics Similar to New Zealanders by In Labor Force | Age 20-24
In terms of in labor force | age 20-24, the demographic groups most similar to New Zealanders are Immigrants from Romania (75.2%, a difference of 0.010%), Costa Rican (75.2%, a difference of 0.020%), Bolivian (75.2%, a difference of 0.020%), Afghan (75.2%, a difference of 0.030%), and Japanese (75.3%, a difference of 0.050%).
| Demographics | Rating | Rank | In Labor Force | Age 20-24 |
| Osage | 72.3 /100 | #154 | Good 75.3% |
| Immigrants | Guatemala | 71.9 /100 | #155 | Good 75.3% |
| Immigrants | El Salvador | 71.7 /100 | #156 | Good 75.3% |
| Immigrants | Western Europe | 71.5 /100 | #157 | Good 75.3% |
| Immigrants | Bolivia | 71.0 /100 | #158 | Good 75.3% |
| South American Indians | 69.0 /100 | #159 | Good 75.3% |
| Japanese | 68.7 /100 | #160 | Good 75.3% |
| New Zealanders | 65.4 /100 | #161 | Good 75.2% |
| Immigrants | Romania | 64.6 /100 | #162 | Good 75.2% |
| Costa Ricans | 64.2 /100 | #163 | Good 75.2% |
| Bolivians | 64.0 /100 | #164 | Good 75.2% |
| Afghans | 63.5 /100 | #165 | Good 75.2% |
| Cambodians | 60.5 /100 | #166 | Good 75.2% |
| Immigrants | South Eastern Asia | 57.5 /100 | #167 | Average 75.1% |
| Immigrants | Western Africa | 56.7 /100 | #168 | Average 75.1% |
Demographics Similar to Immigrants from Northern Africa by In Labor Force | Age 20-24
In terms of in labor force | age 20-24, the demographic groups most similar to Immigrants from Northern Africa are Immigrants from Italy (74.6%, a difference of 0.010%), Inupiat (74.6%, a difference of 0.010%), Sioux (74.6%, a difference of 0.010%), Albanian (74.6%, a difference of 0.040%), and Moroccan (74.7%, a difference of 0.060%).
| Demographics | Rating | Rank | In Labor Force | Age 20-24 |
| Immigrants | Vietnam | 25.1 /100 | #196 | Fair 74.7% |
| Panamanians | 25.0 /100 | #197 | Fair 74.7% |
| Immigrants | Nigeria | 24.2 /100 | #198 | Fair 74.7% |
| Taiwanese | 23.2 /100 | #199 | Fair 74.7% |
| Nigerians | 21.9 /100 | #200 | Fair 74.7% |
| Choctaw | 21.4 /100 | #201 | Fair 74.7% |
| Moroccans | 20.4 /100 | #202 | Fair 74.7% |
| Immigrants | Northern Africa | 17.9 /100 | #203 | Poor 74.6% |
| Immigrants | Italy | 17.6 /100 | #204 | Poor 74.6% |
| Inupiat | 17.6 /100 | #205 | Poor 74.6% |
| Sioux | 17.5 /100 | #206 | Poor 74.6% |
| Albanians | 16.2 /100 | #207 | Poor 74.6% |
| Immigrants | Uruguay | 15.8 /100 | #208 | Poor 74.6% |
| Arabs | 15.8 /100 | #209 | Poor 74.6% |
| Uruguayans | 15.1 /100 | #210 | Poor 74.6% |