Immigrants from Israel vs Immigrants from the Azores In Labor Force | Age > 16
COMPARE
Immigrants from Israel
Immigrants from the Azores
In Labor Force | Age > 16
In Labor Force | Age > 16 Comparison
Immigrants from Israel
Immigrants from the Azores
65.2%
IN LABOR FORCE | AGE > 16
61.7/ 100
METRIC RATING
170th/ 347
METRIC RANK
63.6%
IN LABOR FORCE | AGE > 16
0.0/ 100
METRIC RATING
300th/ 347
METRIC RANK
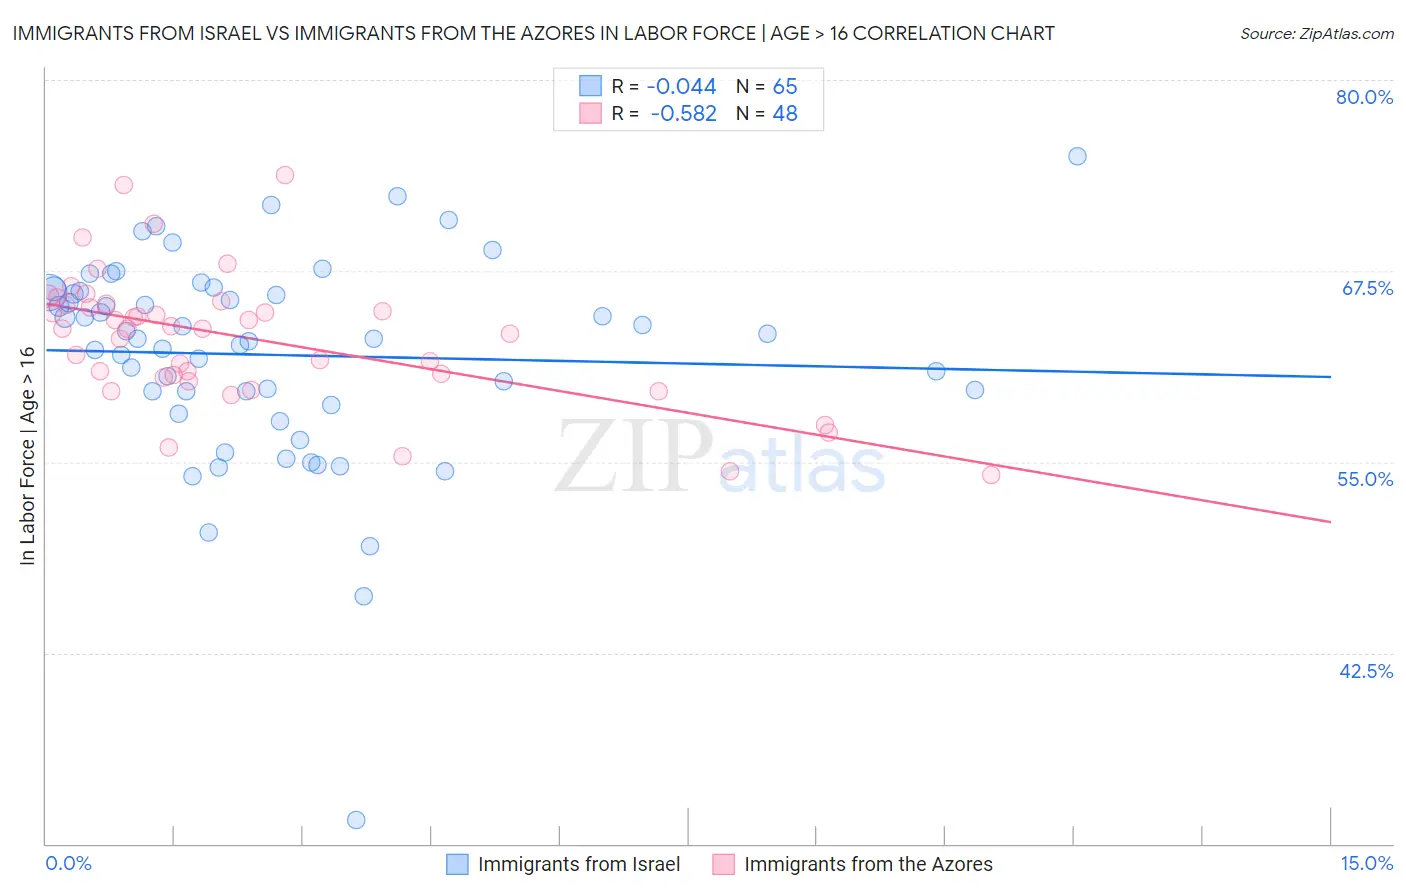
Immigrants from Israel vs Immigrants from the Azores In Labor Force | Age > 16 Correlation Chart
The statistical analysis conducted on geographies consisting of 210,034,419 people shows no correlation between the proportion of Immigrants from Israel and labor force participation rate among population ages 16 and over in the United States with a correlation coefficient (R) of -0.044 and weighted average of 65.2%. Similarly, the statistical analysis conducted on geographies consisting of 46,256,974 people shows a substantial negative correlation between the proportion of Immigrants from the Azores and labor force participation rate among population ages 16 and over in the United States with a correlation coefficient (R) of -0.582 and weighted average of 63.6%, a difference of 2.5%.
In Labor Force | Age > 16 Correlation Summary
| Measurement | Immigrants from Israel | Immigrants from the Azores |
| Minimum | 31.5% | 54.1% |
| Maximum | 75.0% | 73.8% |
| Range | 43.5% | 19.7% |
| Mean | 62.0% | 63.1% |
| Median | 63.1% | 63.7% |
| Interquartile 25% (IQ1) | 59.2% | 60.6% |
| Interquartile 75% (IQ3) | 66.1% | 65.3% |
| Interquartile Range (IQR) | 7.0% | 4.7% |
| Standard Deviation (Sample) | 6.9% | 4.3% |
| Standard Deviation (Population) | 6.8% | 4.2% |
Similar Demographics by In Labor Force | Age > 16
Demographics Similar to Immigrants from Israel by In Labor Force | Age > 16
In terms of in labor force | age > 16, the demographic groups most similar to Immigrants from Israel are Israeli (65.2%, a difference of 0.0%), Immigrants from Sweden (65.2%, a difference of 0.0%), Arab (65.2%, a difference of 0.010%), Serbian (65.2%, a difference of 0.020%), and Immigrants from Belarus (65.2%, a difference of 0.050%).
| Demographics | Rating | Rank | In Labor Force | Age > 16 |
| South Africans | 69.8 /100 | #163 | Good 65.3% |
| Danes | 68.8 /100 | #164 | Good 65.3% |
| Immigrants | Kazakhstan | 68.1 /100 | #165 | Good 65.3% |
| Immigrants | Western Asia | 67.3 /100 | #166 | Good 65.3% |
| Immigrants | Belarus | 66.0 /100 | #167 | Good 65.2% |
| Serbians | 63.5 /100 | #168 | Good 65.2% |
| Arabs | 62.4 /100 | #169 | Good 65.2% |
| Immigrants | Israel | 61.7 /100 | #170 | Good 65.2% |
| Israelis | 61.6 /100 | #171 | Good 65.2% |
| Immigrants | Sweden | 61.3 /100 | #172 | Good 65.2% |
| Immigrants | Ukraine | 53.7 /100 | #173 | Average 65.1% |
| Macedonians | 50.0 /100 | #174 | Average 65.1% |
| Nicaraguans | 49.7 /100 | #175 | Average 65.1% |
| Swedes | 47.4 /100 | #176 | Average 65.1% |
| Eastern Europeans | 46.2 /100 | #177 | Average 65.1% |
Demographics Similar to Immigrants from the Azores by In Labor Force | Age > 16
In terms of in labor force | age > 16, the demographic groups most similar to Immigrants from the Azores are White/Caucasian (63.6%, a difference of 0.010%), Spanish American (63.6%, a difference of 0.030%), Delaware (63.6%, a difference of 0.040%), Comanche (63.6%, a difference of 0.060%), and Immigrants from Grenada (63.6%, a difference of 0.070%).
| Demographics | Rating | Rank | In Labor Force | Age > 16 |
| English | 0.1 /100 | #293 | Tragic 63.7% |
| Puget Sound Salish | 0.0 /100 | #294 | Tragic 63.7% |
| Immigrants | Canada | 0.0 /100 | #295 | Tragic 63.7% |
| Immigrants | North America | 0.0 /100 | #296 | Tragic 63.7% |
| Immigrants | Grenada | 0.0 /100 | #297 | Tragic 63.6% |
| Comanche | 0.0 /100 | #298 | Tragic 63.6% |
| Whites/Caucasians | 0.0 /100 | #299 | Tragic 63.6% |
| Immigrants | Azores | 0.0 /100 | #300 | Tragic 63.6% |
| Spanish Americans | 0.0 /100 | #301 | Tragic 63.6% |
| Delaware | 0.0 /100 | #302 | Tragic 63.6% |
| Cree | 0.0 /100 | #303 | Tragic 63.5% |
| Immigrants | Nonimmigrants | 0.0 /100 | #304 | Tragic 63.5% |
| Osage | 0.0 /100 | #305 | Tragic 63.5% |
| Blacks/African Americans | 0.0 /100 | #306 | Tragic 63.4% |
| Central American Indians | 0.0 /100 | #307 | Tragic 63.4% |