Israeli vs Argentinean In Labor Force | Age 45-54
COMPARE
Israeli
Argentinean
In Labor Force | Age 45-54
In Labor Force | Age 45-54 Comparison
Israelis
Argentineans
82.7%
IN LABOR FORCE | AGE 45-54
37.7/ 100
METRIC RATING
181st/ 347
METRIC RANK
83.3%
IN LABOR FORCE | AGE 45-54
94.9/ 100
METRIC RATING
94th/ 347
METRIC RANK
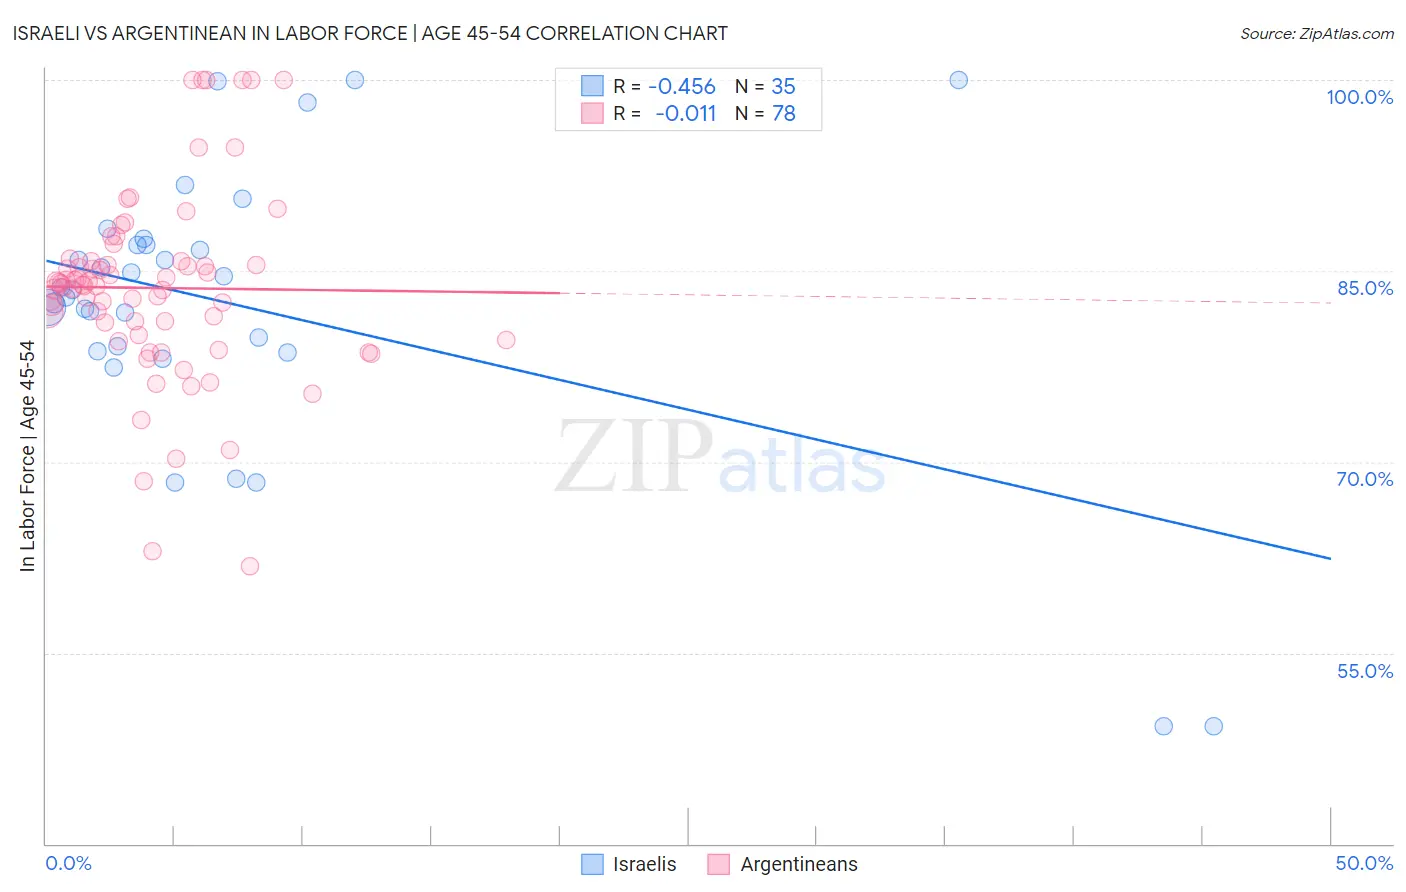
Israeli vs Argentinean In Labor Force | Age 45-54 Correlation Chart
The statistical analysis conducted on geographies consisting of 211,012,098 people shows a moderate negative correlation between the proportion of Israelis and labor force participation rate among population between the ages 45 and 54 in the United States with a correlation coefficient (R) of -0.456 and weighted average of 82.7%. Similarly, the statistical analysis conducted on geographies consisting of 296,984,217 people shows no correlation between the proportion of Argentineans and labor force participation rate among population between the ages 45 and 54 in the United States with a correlation coefficient (R) of -0.011 and weighted average of 83.3%, a difference of 0.76%.
In Labor Force | Age 45-54 Correlation Summary
| Measurement | Israeli | Argentinean |
| Minimum | 49.2% | 61.8% |
| Maximum | 100.0% | 100.0% |
| Range | 50.8% | 38.2% |
| Mean | 82.3% | 83.7% |
| Median | 83.5% | 83.9% |
| Interquartile 25% (IQ1) | 78.7% | 80.0% |
| Interquartile 75% (IQ3) | 87.0% | 85.7% |
| Interquartile Range (IQR) | 8.3% | 5.8% |
| Standard Deviation (Sample) | 11.3% | 7.4% |
| Standard Deviation (Population) | 11.2% | 7.4% |
Similar Demographics by In Labor Force | Age 45-54
Demographics Similar to Israelis by In Labor Force | Age 45-54
In terms of in labor force | age 45-54, the demographic groups most similar to Israelis are Hungarian (82.7%, a difference of 0.0%), Immigrants from Hungary (82.7%, a difference of 0.010%), Immigrants from Switzerland (82.7%, a difference of 0.020%), Nigerian (82.7%, a difference of 0.030%), and New Zealander (82.6%, a difference of 0.050%).
| Demographics | Rating | Rank | In Labor Force | Age 45-54 |
| Costa Ricans | 50.0 /100 | #174 | Average 82.8% |
| Immigrants | Liberia | 47.9 /100 | #175 | Average 82.7% |
| Northern Europeans | 46.9 /100 | #176 | Average 82.7% |
| Immigrants | Nicaragua | 44.6 /100 | #177 | Average 82.7% |
| Nigerians | 40.5 /100 | #178 | Average 82.7% |
| Immigrants | Switzerland | 39.4 /100 | #179 | Fair 82.7% |
| Hungarians | 38.0 /100 | #180 | Fair 82.7% |
| Israelis | 37.7 /100 | #181 | Fair 82.7% |
| Immigrants | Hungary | 37.1 /100 | #182 | Fair 82.7% |
| New Zealanders | 32.7 /100 | #183 | Fair 82.6% |
| Europeans | 32.6 /100 | #184 | Fair 82.6% |
| Immigrants | England | 32.2 /100 | #185 | Fair 82.6% |
| Irish | 29.2 /100 | #186 | Fair 82.6% |
| Immigrants | Costa Rica | 28.3 /100 | #187 | Fair 82.6% |
| South Africans | 28.0 /100 | #188 | Fair 82.6% |
Demographics Similar to Argentineans by In Labor Force | Age 45-54
In terms of in labor force | age 45-54, the demographic groups most similar to Argentineans are Immigrants from Argentina (83.3%, a difference of 0.0%), Italian (83.3%, a difference of 0.010%), Immigrants from Kuwait (83.3%, a difference of 0.010%), Palestinian (83.3%, a difference of 0.010%), and Danish (83.3%, a difference of 0.020%).
| Demographics | Rating | Rank | In Labor Force | Age 45-54 |
| Immigrants | Eastern Europe | 95.6 /100 | #87 | Exceptional 83.3% |
| Immigrants | Asia | 95.6 /100 | #88 | Exceptional 83.3% |
| Indians (Asian) | 95.5 /100 | #89 | Exceptional 83.3% |
| Immigrants | Japan | 95.5 /100 | #90 | Exceptional 83.3% |
| South Americans | 95.5 /100 | #91 | Exceptional 83.3% |
| Danes | 95.3 /100 | #92 | Exceptional 83.3% |
| Italians | 95.1 /100 | #93 | Exceptional 83.3% |
| Argentineans | 94.9 /100 | #94 | Exceptional 83.3% |
| Immigrants | Argentina | 94.9 /100 | #95 | Exceptional 83.3% |
| Immigrants | Kuwait | 94.8 /100 | #96 | Exceptional 83.3% |
| Palestinians | 94.8 /100 | #97 | Exceptional 83.3% |
| Maltese | 94.4 /100 | #98 | Exceptional 83.3% |
| Immigrants | Middle Africa | 94.3 /100 | #99 | Exceptional 83.3% |
| Mongolians | 94.2 /100 | #100 | Exceptional 83.3% |
| Immigrants | Belarus | 94.1 /100 | #101 | Exceptional 83.3% |