Immigrants from North America vs Argentinean In Labor Force | Age 45-54
COMPARE
Immigrants from North America
Argentinean
In Labor Force | Age 45-54
In Labor Force | Age 45-54 Comparison
Immigrants from North America
Argentineans
82.5%
IN LABOR FORCE | AGE 45-54
18.8/ 100
METRIC RATING
196th/ 347
METRIC RANK
83.3%
IN LABOR FORCE | AGE 45-54
94.9/ 100
METRIC RATING
94th/ 347
METRIC RANK
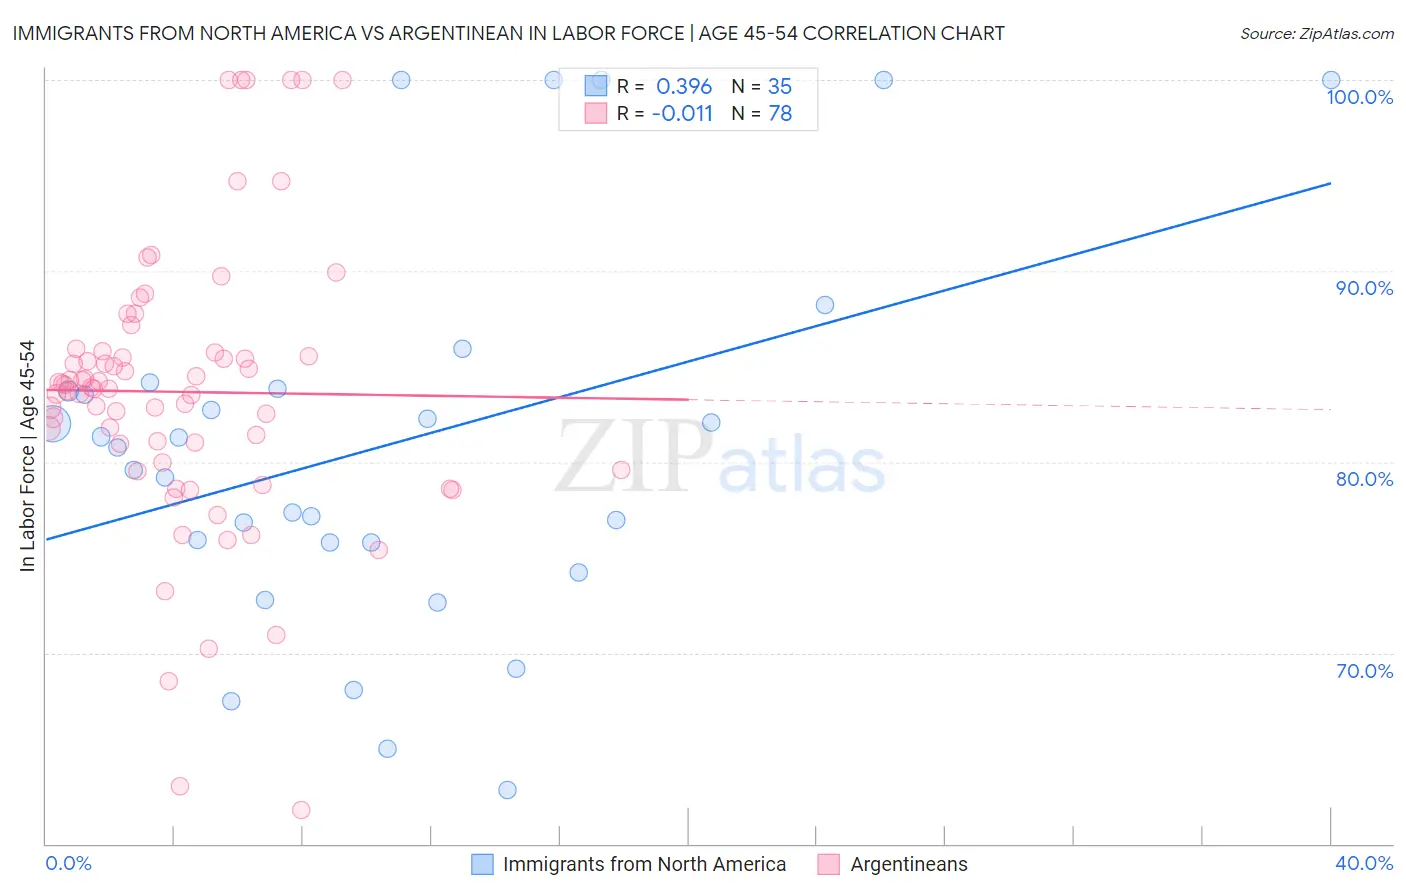
Immigrants from North America vs Argentinean In Labor Force | Age 45-54 Correlation Chart
The statistical analysis conducted on geographies consisting of 462,161,293 people shows a mild positive correlation between the proportion of Immigrants from North America and labor force participation rate among population between the ages 45 and 54 in the United States with a correlation coefficient (R) of 0.396 and weighted average of 82.5%. Similarly, the statistical analysis conducted on geographies consisting of 296,984,217 people shows no correlation between the proportion of Argentineans and labor force participation rate among population between the ages 45 and 54 in the United States with a correlation coefficient (R) of -0.011 and weighted average of 83.3%, a difference of 0.97%.
In Labor Force | Age 45-54 Correlation Summary
| Measurement | Immigrants from North America | Argentinean |
| Minimum | 62.8% | 61.8% |
| Maximum | 100.0% | 100.0% |
| Range | 37.2% | 38.2% |
| Mean | 80.8% | 83.7% |
| Median | 80.7% | 83.9% |
| Interquartile 25% (IQ1) | 75.8% | 80.0% |
| Interquartile 75% (IQ3) | 83.9% | 85.7% |
| Interquartile Range (IQR) | 8.1% | 5.8% |
| Standard Deviation (Sample) | 9.9% | 7.4% |
| Standard Deviation (Population) | 9.7% | 7.4% |
Similar Demographics by In Labor Force | Age 45-54
Demographics Similar to Immigrants from North America by In Labor Force | Age 45-54
In terms of in labor force | age 45-54, the demographic groups most similar to Immigrants from North America are Lebanese (82.5%, a difference of 0.010%), Immigrants from Denmark (82.5%, a difference of 0.010%), Immigrants from Canada (82.5%, a difference of 0.020%), Immigrants from Iraq (82.5%, a difference of 0.030%), and Australian (82.5%, a difference of 0.030%).
| Demographics | Rating | Rank | In Labor Force | Age 45-54 |
| Syrians | 26.0 /100 | #189 | Fair 82.6% |
| British | 25.7 /100 | #190 | Fair 82.6% |
| Armenians | 23.2 /100 | #191 | Fair 82.5% |
| Immigrants | Iraq | 20.9 /100 | #192 | Fair 82.5% |
| Australians | 20.8 /100 | #193 | Fair 82.5% |
| Immigrants | Norway | 20.7 /100 | #194 | Fair 82.5% |
| Immigrants | Canada | 20.0 /100 | #195 | Fair 82.5% |
| Immigrants | North America | 18.8 /100 | #196 | Poor 82.5% |
| Lebanese | 18.2 /100 | #197 | Poor 82.5% |
| Immigrants | Denmark | 17.9 /100 | #198 | Poor 82.5% |
| Moroccans | 15.7 /100 | #199 | Poor 82.5% |
| French Canadians | 15.4 /100 | #200 | Poor 82.5% |
| Canadians | 15.1 /100 | #201 | Poor 82.4% |
| Immigrants | Western Asia | 14.9 /100 | #202 | Poor 82.4% |
| Arabs | 11.6 /100 | #203 | Poor 82.4% |
Demographics Similar to Argentineans by In Labor Force | Age 45-54
In terms of in labor force | age 45-54, the demographic groups most similar to Argentineans are Immigrants from Argentina (83.3%, a difference of 0.0%), Italian (83.3%, a difference of 0.010%), Immigrants from Kuwait (83.3%, a difference of 0.010%), Palestinian (83.3%, a difference of 0.010%), and Danish (83.3%, a difference of 0.020%).
| Demographics | Rating | Rank | In Labor Force | Age 45-54 |
| Immigrants | Eastern Europe | 95.6 /100 | #87 | Exceptional 83.3% |
| Immigrants | Asia | 95.6 /100 | #88 | Exceptional 83.3% |
| Indians (Asian) | 95.5 /100 | #89 | Exceptional 83.3% |
| Immigrants | Japan | 95.5 /100 | #90 | Exceptional 83.3% |
| South Americans | 95.5 /100 | #91 | Exceptional 83.3% |
| Danes | 95.3 /100 | #92 | Exceptional 83.3% |
| Italians | 95.1 /100 | #93 | Exceptional 83.3% |
| Argentineans | 94.9 /100 | #94 | Exceptional 83.3% |
| Immigrants | Argentina | 94.9 /100 | #95 | Exceptional 83.3% |
| Immigrants | Kuwait | 94.8 /100 | #96 | Exceptional 83.3% |
| Palestinians | 94.8 /100 | #97 | Exceptional 83.3% |
| Maltese | 94.4 /100 | #98 | Exceptional 83.3% |
| Immigrants | Middle Africa | 94.3 /100 | #99 | Exceptional 83.3% |
| Mongolians | 94.2 /100 | #100 | Exceptional 83.3% |
| Immigrants | Belarus | 94.1 /100 | #101 | Exceptional 83.3% |