English vs Immigrants from Micronesia In Labor Force | Age 25-29
COMPARE
English
Immigrants from Micronesia
In Labor Force | Age 25-29
In Labor Force | Age 25-29 Comparison
English
Immigrants from Micronesia
84.5%
IN LABOR FORCE | AGE 25-29
25.8/ 100
METRIC RATING
192nd/ 347
METRIC RANK
83.0%
IN LABOR FORCE | AGE 25-29
0.0/ 100
METRIC RATING
289th/ 347
METRIC RANK
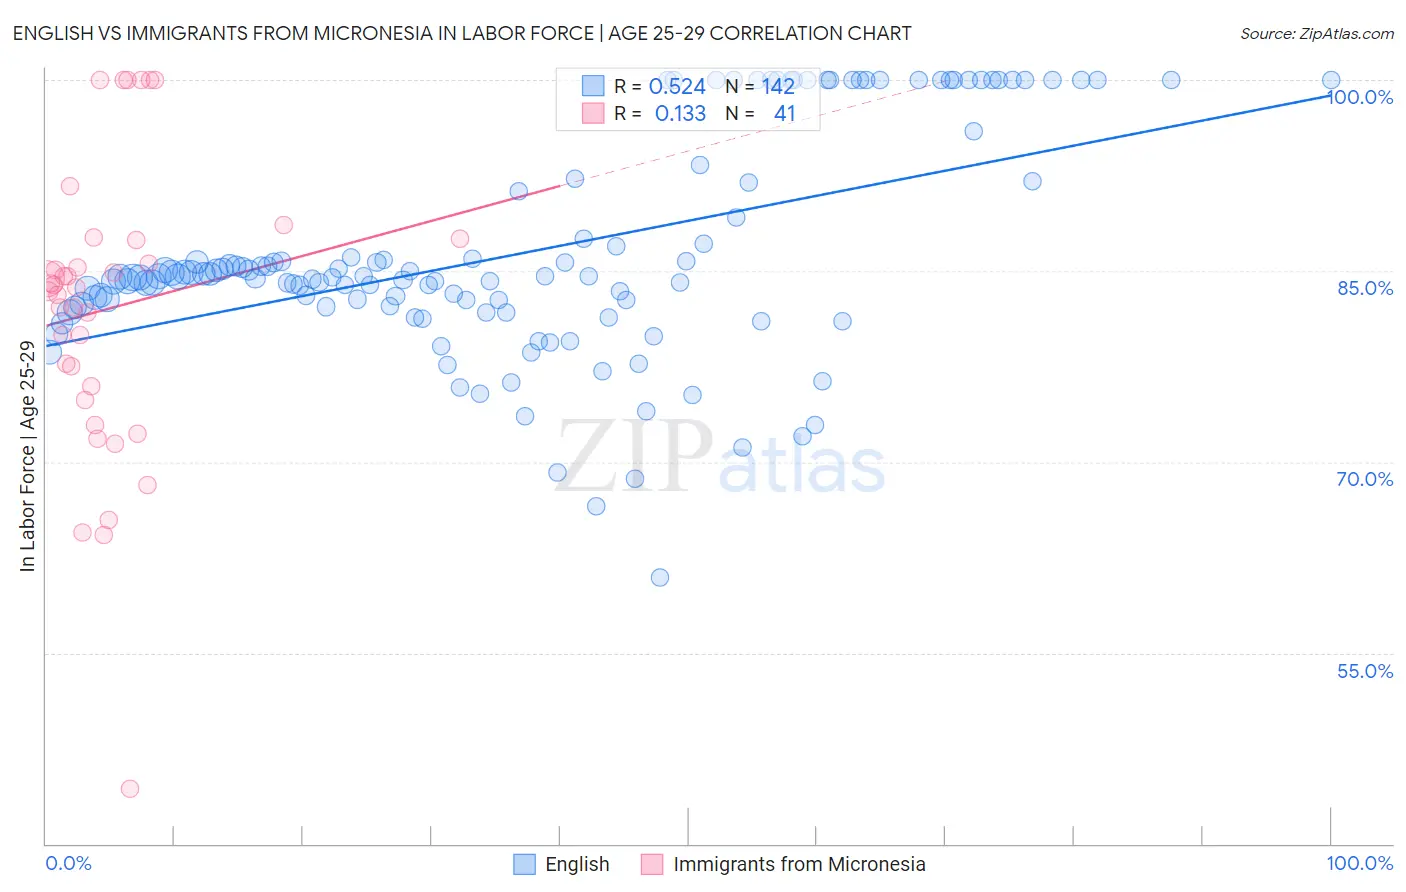
English vs Immigrants from Micronesia In Labor Force | Age 25-29 Correlation Chart
The statistical analysis conducted on geographies consisting of 577,776,495 people shows a substantial positive correlation between the proportion of English and labor force participation rate among population between the ages 25 and 29 in the United States with a correlation coefficient (R) of 0.524 and weighted average of 84.5%. Similarly, the statistical analysis conducted on geographies consisting of 61,602,386 people shows a poor positive correlation between the proportion of Immigrants from Micronesia and labor force participation rate among population between the ages 25 and 29 in the United States with a correlation coefficient (R) of 0.133 and weighted average of 83.0%, a difference of 1.8%.
In Labor Force | Age 25-29 Correlation Summary
| Measurement | English | Immigrants from Micronesia |
| Minimum | 60.9% | 44.3% |
| Maximum | 100.0% | 100.0% |
| Range | 39.1% | 55.7% |
| Mean | 86.4% | 82.0% |
| Median | 84.5% | 83.7% |
| Interquartile 25% (IQ1) | 82.2% | 75.4% |
| Interquartile 75% (IQ3) | 91.9% | 87.4% |
| Interquartile Range (IQR) | 9.7% | 12.0% |
| Standard Deviation (Sample) | 8.6% | 11.5% |
| Standard Deviation (Population) | 8.6% | 11.4% |
Similar Demographics by In Labor Force | Age 25-29
Demographics Similar to English by In Labor Force | Age 25-29
In terms of in labor force | age 25-29, the demographic groups most similar to English are South American Indian (84.5%, a difference of 0.010%), Zimbabwean (84.5%, a difference of 0.030%), Welsh (84.5%, a difference of 0.050%), Portuguese (84.4%, a difference of 0.050%), and Immigrants from Israel (84.4%, a difference of 0.050%).
| Demographics | Rating | Rank | In Labor Force | Age 25-29 |
| Immigrants | Denmark | 37.0 /100 | #185 | Fair 84.6% |
| Immigrants | Belgium | 35.0 /100 | #186 | Fair 84.6% |
| Immigrants | Portugal | 34.7 /100 | #187 | Fair 84.6% |
| Immigrants | Ukraine | 33.7 /100 | #188 | Fair 84.5% |
| Moroccans | 32.6 /100 | #189 | Fair 84.5% |
| Welsh | 31.1 /100 | #190 | Fair 84.5% |
| Zimbabweans | 28.7 /100 | #191 | Fair 84.5% |
| English | 25.8 /100 | #192 | Fair 84.5% |
| South American Indians | 25.0 /100 | #193 | Fair 84.5% |
| Portuguese | 21.2 /100 | #194 | Fair 84.4% |
| Immigrants | Israel | 20.8 /100 | #195 | Fair 84.4% |
| Immigrants | South Eastern Asia | 19.5 /100 | #196 | Poor 84.4% |
| Tlingit-Haida | 19.3 /100 | #197 | Poor 84.4% |
| Immigrants | Iraq | 19.0 /100 | #198 | Poor 84.4% |
| Immigrants | Germany | 18.3 /100 | #199 | Poor 84.4% |
Demographics Similar to Immigrants from Micronesia by In Labor Force | Age 25-29
In terms of in labor force | age 25-29, the demographic groups most similar to Immigrants from Micronesia are Ottawa (83.0%, a difference of 0.020%), Immigrants from Bangladesh (83.0%, a difference of 0.030%), Hawaiian (83.0%, a difference of 0.030%), Guyanese (83.0%, a difference of 0.050%), and Immigrants from Guyana (83.0%, a difference of 0.050%).
| Demographics | Rating | Rank | In Labor Force | Age 25-29 |
| Americans | 0.0 /100 | #282 | Tragic 83.1% |
| Immigrants | Azores | 0.0 /100 | #283 | Tragic 83.1% |
| Nicaraguans | 0.0 /100 | #284 | Tragic 83.1% |
| Belizeans | 0.0 /100 | #285 | Tragic 83.1% |
| Mexican American Indians | 0.0 /100 | #286 | Tragic 83.0% |
| Guyanese | 0.0 /100 | #287 | Tragic 83.0% |
| Ottawa | 0.0 /100 | #288 | Tragic 83.0% |
| Immigrants | Micronesia | 0.0 /100 | #289 | Tragic 83.0% |
| Immigrants | Bangladesh | 0.0 /100 | #290 | Tragic 83.0% |
| Hawaiians | 0.0 /100 | #291 | Tragic 83.0% |
| Immigrants | Guyana | 0.0 /100 | #292 | Tragic 83.0% |
| Immigrants | Latin America | 0.0 /100 | #293 | Tragic 82.9% |
| Nepalese | 0.0 /100 | #294 | Tragic 82.9% |
| Chippewa | 0.0 /100 | #295 | Tragic 82.9% |
| Immigrants | Nicaragua | 0.0 /100 | #296 | Tragic 82.9% |