Filipino vs Immigrants from Kenya In Labor Force | Age 20-64
COMPARE
Filipino
Immigrants from Kenya
In Labor Force | Age 20-64
In Labor Force | Age 20-64 Comparison
Filipinos
Immigrants from Kenya
80.1%
IN LABOR FORCE | AGE 20-64
95.6/ 100
METRIC RATING
100th/ 347
METRIC RANK
80.7%
IN LABOR FORCE | AGE 20-64
99.9/ 100
METRIC RATING
27th/ 347
METRIC RANK
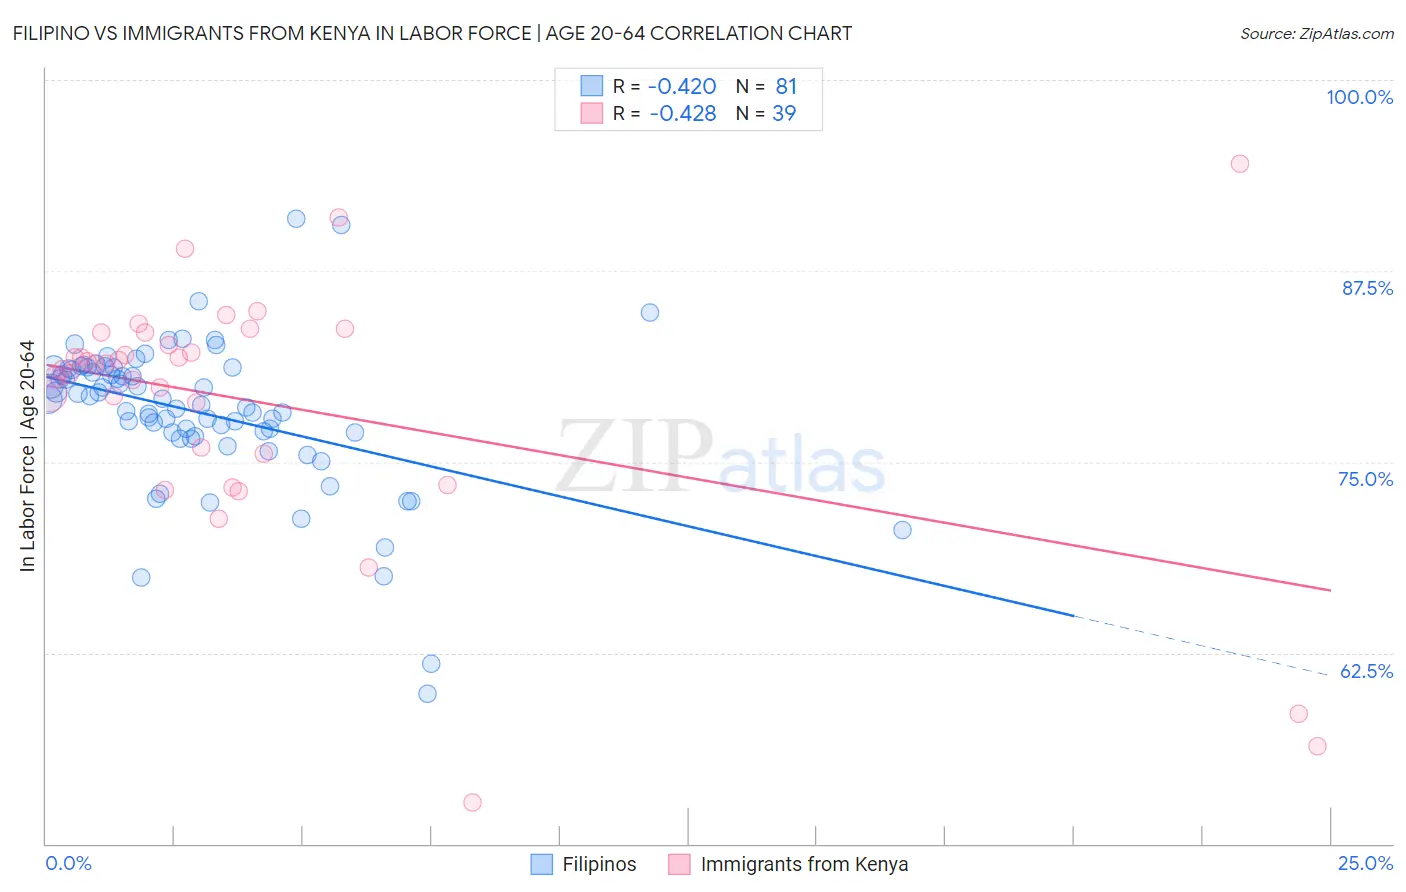
Filipino vs Immigrants from Kenya In Labor Force | Age 20-64 Correlation Chart
The statistical analysis conducted on geographies consisting of 254,357,884 people shows a moderate negative correlation between the proportion of Filipinos and labor force participation rate among population between the ages 20 and 64 in the United States with a correlation coefficient (R) of -0.420 and weighted average of 80.1%. Similarly, the statistical analysis conducted on geographies consisting of 218,088,200 people shows a moderate negative correlation between the proportion of Immigrants from Kenya and labor force participation rate among population between the ages 20 and 64 in the United States with a correlation coefficient (R) of -0.428 and weighted average of 80.7%, a difference of 0.87%.
In Labor Force | Age 20-64 Correlation Summary
| Measurement | Filipino | Immigrants from Kenya |
| Minimum | 59.8% | 52.7% |
| Maximum | 90.9% | 94.5% |
| Range | 31.1% | 41.8% |
| Mean | 78.2% | 78.8% |
| Median | 79.1% | 81.4% |
| Interquartile 25% (IQ1) | 76.8% | 75.6% |
| Interquartile 75% (IQ3) | 81.1% | 83.4% |
| Interquartile Range (IQR) | 4.4% | 7.9% |
| Standard Deviation (Sample) | 5.0% | 8.4% |
| Standard Deviation (Population) | 4.9% | 8.3% |
Similar Demographics by In Labor Force | Age 20-64
Demographics Similar to Filipinos by In Labor Force | Age 20-64
In terms of in labor force | age 20-64, the demographic groups most similar to Filipinos are Palestinian (80.0%, a difference of 0.0%), Immigrants from Australia (80.0%, a difference of 0.0%), South American (80.1%, a difference of 0.010%), Immigrants from Uruguay (80.1%, a difference of 0.010%), and Immigrants from Chile (80.1%, a difference of 0.010%).
| Demographics | Rating | Rank | In Labor Force | Age 20-64 |
| Immigrants | Belarus | 96.4 /100 | #93 | Exceptional 80.1% |
| Immigrants | Asia | 96.0 /100 | #94 | Exceptional 80.1% |
| Yugoslavians | 95.9 /100 | #95 | Exceptional 80.1% |
| Immigrants | Malaysia | 95.9 /100 | #96 | Exceptional 80.1% |
| South Americans | 95.9 /100 | #97 | Exceptional 80.1% |
| Immigrants | Uruguay | 95.8 /100 | #98 | Exceptional 80.1% |
| Immigrants | Chile | 95.7 /100 | #99 | Exceptional 80.1% |
| Filipinos | 95.6 /100 | #100 | Exceptional 80.1% |
| Palestinians | 95.5 /100 | #101 | Exceptional 80.0% |
| Immigrants | Australia | 95.5 /100 | #102 | Exceptional 80.0% |
| Russians | 95.5 /100 | #103 | Exceptional 80.0% |
| Venezuelans | 95.3 /100 | #104 | Exceptional 80.0% |
| Immigrants | Ghana | 95.0 /100 | #105 | Exceptional 80.0% |
| Greeks | 94.8 /100 | #106 | Exceptional 80.0% |
| Immigrants | Jordan | 94.8 /100 | #107 | Exceptional 80.0% |
Demographics Similar to Immigrants from Kenya by In Labor Force | Age 20-64
In terms of in labor force | age 20-64, the demographic groups most similar to Immigrants from Kenya are Immigrants from Uganda (80.7%, a difference of 0.010%), Immigrants from South Central Asia (80.7%, a difference of 0.030%), Immigrants from North Macedonia (80.7%, a difference of 0.030%), Immigrants from Lithuania (80.7%, a difference of 0.050%), and Immigrants from Ireland (80.7%, a difference of 0.060%).
| Demographics | Rating | Rank | In Labor Force | Age 20-64 |
| Thais | 100.0 /100 | #20 | Exceptional 80.9% |
| Liberians | 100.0 /100 | #21 | Exceptional 80.9% |
| Sudanese | 100.0 /100 | #22 | Exceptional 80.8% |
| Immigrants | Bosnia and Herzegovina | 100.0 /100 | #23 | Exceptional 80.8% |
| Immigrants | Morocco | 100.0 /100 | #24 | Exceptional 80.8% |
| Kenyans | 100.0 /100 | #25 | Exceptional 80.8% |
| Immigrants | Serbia | 100.0 /100 | #26 | Exceptional 80.8% |
| Immigrants | Kenya | 99.9 /100 | #27 | Exceptional 80.7% |
| Immigrants | Uganda | 99.9 /100 | #28 | Exceptional 80.7% |
| Immigrants | South Central Asia | 99.9 /100 | #29 | Exceptional 80.7% |
| Immigrants | North Macedonia | 99.9 /100 | #30 | Exceptional 80.7% |
| Immigrants | Lithuania | 99.9 /100 | #31 | Exceptional 80.7% |
| Immigrants | Ireland | 99.9 /100 | #32 | Exceptional 80.7% |
| Chinese | 99.9 /100 | #33 | Exceptional 80.7% |
| Immigrants | Brazil | 99.9 /100 | #34 | Exceptional 80.7% |