Spanish American Indian vs Immigrants from England In Labor Force | Age 16-19
COMPARE
Spanish American Indian
Immigrants from England
In Labor Force | Age 16-19
In Labor Force | Age 16-19 Comparison
Spanish American Indians
Immigrants from England
32.4%
IN LABOR FORCE | AGE 16-19
0.0/ 100
METRIC RATING
306th/ 347
METRIC RANK
38.1%
IN LABOR FORCE | AGE 16-19
96.4/ 100
METRIC RATING
124th/ 347
METRIC RANK
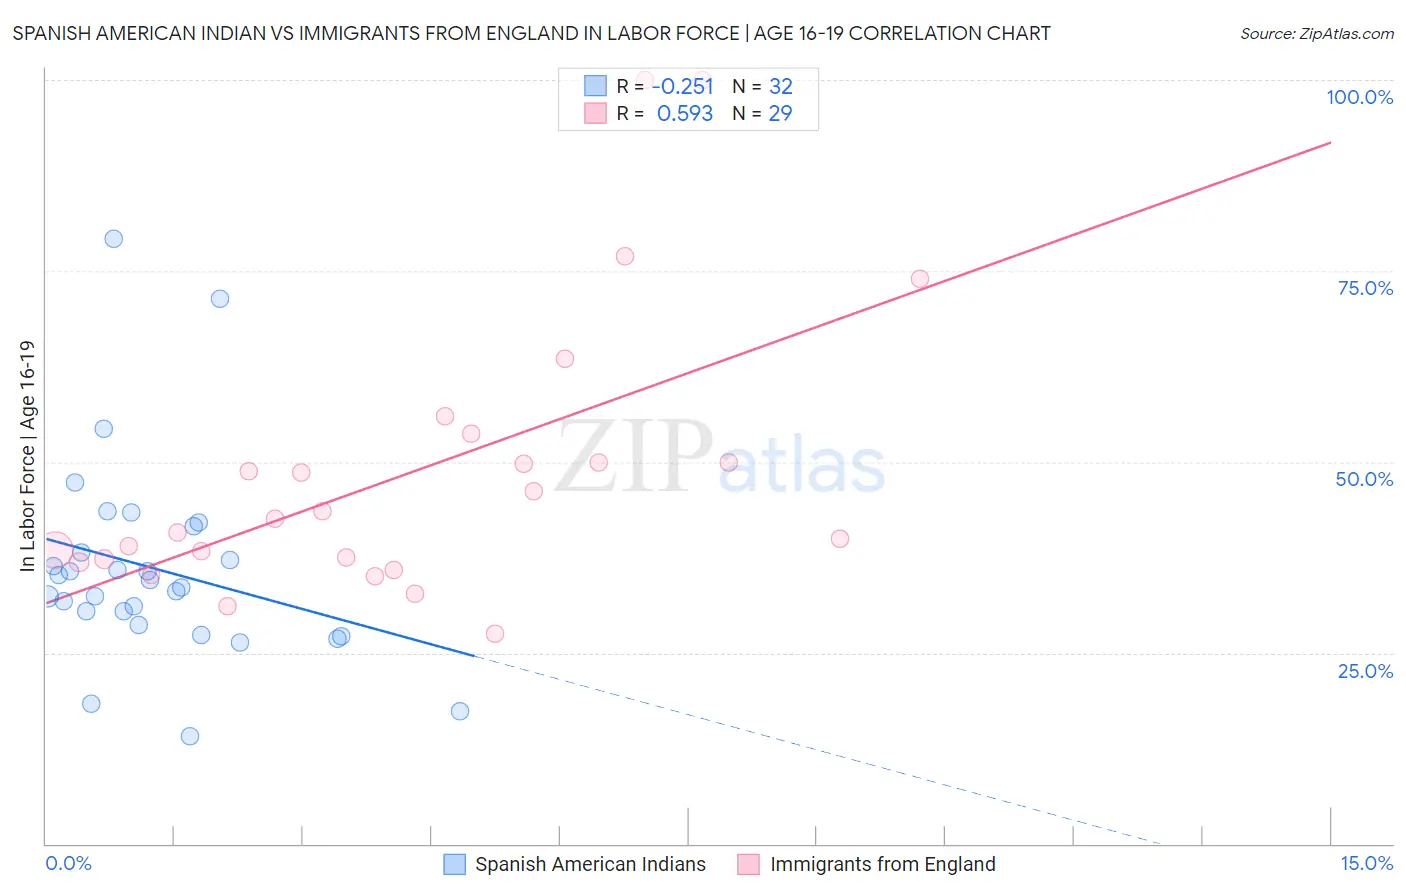
Spanish American Indian vs Immigrants from England In Labor Force | Age 16-19 Correlation Chart
The statistical analysis conducted on geographies consisting of 73,134,655 people shows a weak negative correlation between the proportion of Spanish American Indians and labor force participation rate among population between the ages 16 and 19 in the United States with a correlation coefficient (R) of -0.251 and weighted average of 32.4%. Similarly, the statistical analysis conducted on geographies consisting of 391,103,684 people shows a substantial positive correlation between the proportion of Immigrants from England and labor force participation rate among population between the ages 16 and 19 in the United States with a correlation coefficient (R) of 0.593 and weighted average of 38.1%, a difference of 17.7%.
In Labor Force | Age 16-19 Correlation Summary
| Measurement | Spanish American Indian | Immigrants from England |
| Minimum | 14.1% | 27.4% |
| Maximum | 79.2% | 100.0% |
| Range | 65.1% | 72.6% |
| Mean | 36.0% | 48.6% |
| Median | 34.0% | 42.5% |
| Interquartile 25% (IQ1) | 29.6% | 37.1% |
| Interquartile 75% (IQ3) | 39.9% | 51.9% |
| Interquartile Range (IQR) | 10.3% | 14.8% |
| Standard Deviation (Sample) | 13.2% | 18.4% |
| Standard Deviation (Population) | 13.0% | 18.1% |
Similar Demographics by In Labor Force | Age 16-19
Demographics Similar to Spanish American Indians by In Labor Force | Age 16-19
In terms of in labor force | age 16-19, the demographic groups most similar to Spanish American Indians are Nicaraguan (32.4%, a difference of 0.13%), Israeli (32.4%, a difference of 0.18%), Immigrants from Dominica (32.5%, a difference of 0.37%), Immigrants from Jamaica (32.2%, a difference of 0.49%), and Navajo (32.1%, a difference of 0.84%).
| Demographics | Rating | Rank | In Labor Force | Age 16-19 |
| Armenians | 0.0 /100 | #299 | Tragic 32.9% |
| Immigrants | Argentina | 0.0 /100 | #300 | Tragic 32.9% |
| Okinawans | 0.0 /100 | #301 | Tragic 32.8% |
| Belizeans | 0.0 /100 | #302 | Tragic 32.8% |
| Immigrants | Dominica | 0.0 /100 | #303 | Tragic 32.5% |
| Israelis | 0.0 /100 | #304 | Tragic 32.4% |
| Nicaraguans | 0.0 /100 | #305 | Tragic 32.4% |
| Spanish American Indians | 0.0 /100 | #306 | Tragic 32.4% |
| Immigrants | Jamaica | 0.0 /100 | #307 | Tragic 32.2% |
| Navajo | 0.0 /100 | #308 | Tragic 32.1% |
| Immigrants | Eastern Asia | 0.0 /100 | #309 | Tragic 32.0% |
| Immigrants | Iran | 0.0 /100 | #310 | Tragic 32.0% |
| Indians (Asian) | 0.0 /100 | #311 | Tragic 31.9% |
| Immigrants | Belize | 0.0 /100 | #312 | Tragic 31.8% |
| Hopi | 0.0 /100 | #313 | Tragic 31.8% |
Demographics Similar to Immigrants from England by In Labor Force | Age 16-19
In terms of in labor force | age 16-19, the demographic groups most similar to Immigrants from England are Seminole (38.1%, a difference of 0.080%), Immigrants from Africa (38.0%, a difference of 0.10%), African (38.0%, a difference of 0.26%), Choctaw (38.0%, a difference of 0.27%), and New Zealander (38.0%, a difference of 0.27%).
| Demographics | Rating | Rank | In Labor Force | Age 16-19 |
| Chickasaw | 97.8 /100 | #117 | Exceptional 38.3% |
| Immigrants | Nepal | 97.8 /100 | #118 | Exceptional 38.3% |
| Assyrians/Chaldeans/Syriacs | 97.8 /100 | #119 | Exceptional 38.3% |
| Ukrainians | 97.6 /100 | #120 | Exceptional 38.3% |
| Ethiopians | 97.4 /100 | #121 | Exceptional 38.2% |
| Guamanians/Chamorros | 97.4 /100 | #122 | Exceptional 38.2% |
| Seminole | 96.7 /100 | #123 | Exceptional 38.1% |
| Immigrants | England | 96.4 /100 | #124 | Exceptional 38.1% |
| Immigrants | Africa | 96.1 /100 | #125 | Exceptional 38.0% |
| Africans | 95.6 /100 | #126 | Exceptional 38.0% |
| Choctaw | 95.6 /100 | #127 | Exceptional 38.0% |
| New Zealanders | 95.6 /100 | #128 | Exceptional 38.0% |
| Spaniards | 95.5 /100 | #129 | Exceptional 38.0% |
| Immigrants | Zimbabwe | 95.4 /100 | #130 | Exceptional 38.0% |
| Immigrants | Austria | 95.0 /100 | #131 | Exceptional 37.9% |