Spanish American Indian vs Pima In Labor Force | Age 16-19
COMPARE
Spanish American Indian
Pima
In Labor Force | Age 16-19
In Labor Force | Age 16-19 Comparison
Spanish American Indians
Pima
32.4%
IN LABOR FORCE | AGE 16-19
0.0/ 100
METRIC RATING
306th/ 347
METRIC RANK
34.1%
IN LABOR FORCE | AGE 16-19
0.5/ 100
METRIC RATING
269th/ 347
METRIC RANK
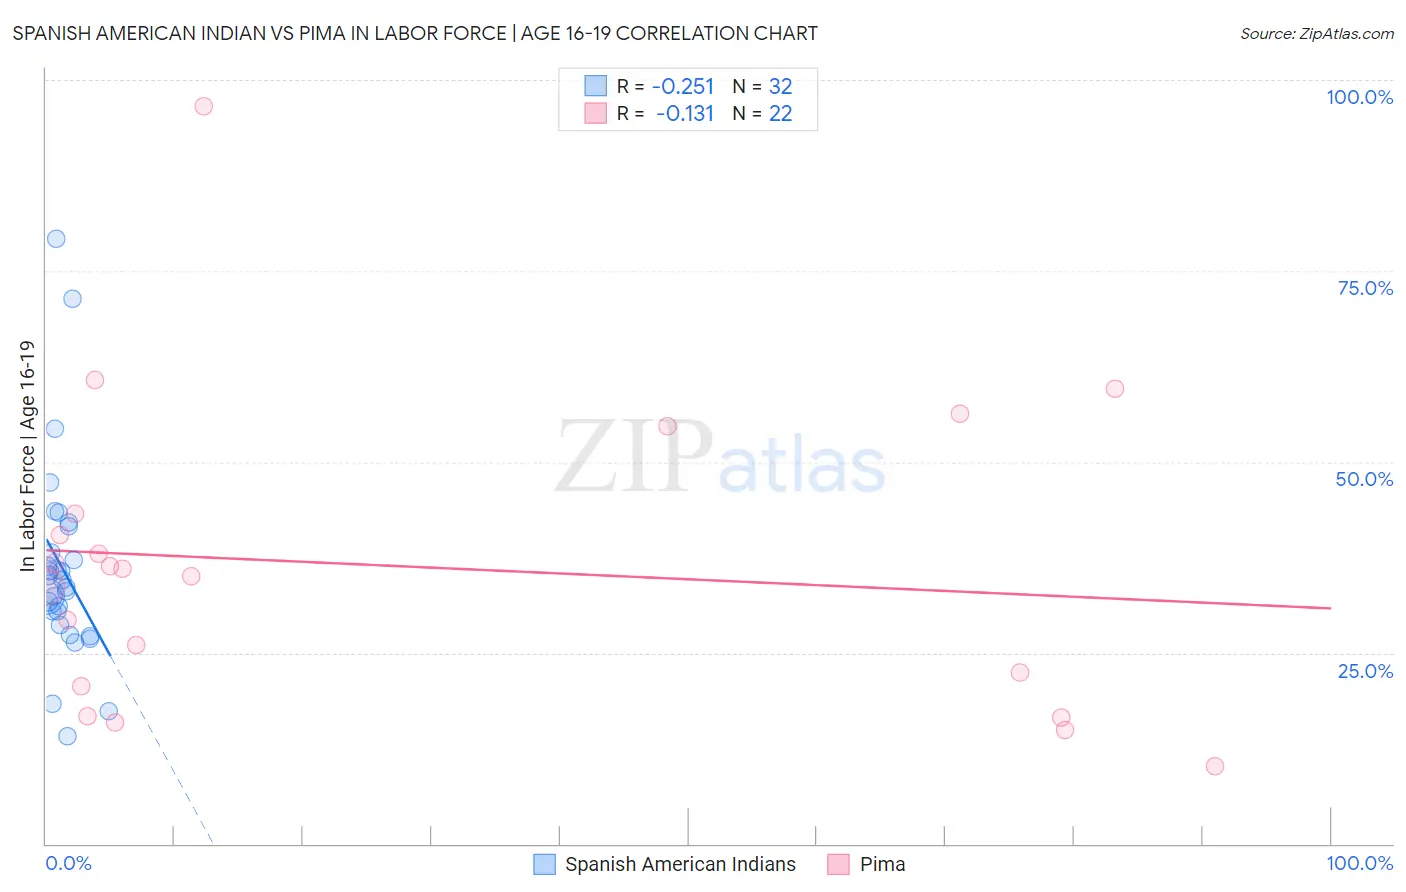
Spanish American Indian vs Pima In Labor Force | Age 16-19 Correlation Chart
The statistical analysis conducted on geographies consisting of 73,134,655 people shows a weak negative correlation between the proportion of Spanish American Indians and labor force participation rate among population between the ages 16 and 19 in the United States with a correlation coefficient (R) of -0.251 and weighted average of 32.4%. Similarly, the statistical analysis conducted on geographies consisting of 61,494,097 people shows a poor negative correlation between the proportion of Pima and labor force participation rate among population between the ages 16 and 19 in the United States with a correlation coefficient (R) of -0.131 and weighted average of 34.1%, a difference of 5.4%.
In Labor Force | Age 16-19 Correlation Summary
| Measurement | Spanish American Indian | Pima |
| Minimum | 14.1% | 10.2% |
| Maximum | 79.2% | 96.6% |
| Range | 65.1% | 86.4% |
| Mean | 36.0% | 36.4% |
| Median | 34.0% | 35.6% |
| Interquartile 25% (IQ1) | 29.6% | 20.7% |
| Interquartile 75% (IQ3) | 39.9% | 43.3% |
| Interquartile Range (IQR) | 10.3% | 22.6% |
| Standard Deviation (Sample) | 13.2% | 20.1% |
| Standard Deviation (Population) | 13.0% | 19.7% |
Similar Demographics by In Labor Force | Age 16-19
Demographics Similar to Spanish American Indians by In Labor Force | Age 16-19
In terms of in labor force | age 16-19, the demographic groups most similar to Spanish American Indians are Nicaraguan (32.4%, a difference of 0.13%), Israeli (32.4%, a difference of 0.18%), Immigrants from Dominica (32.5%, a difference of 0.37%), Immigrants from Jamaica (32.2%, a difference of 0.49%), and Navajo (32.1%, a difference of 0.84%).
| Demographics | Rating | Rank | In Labor Force | Age 16-19 |
| Armenians | 0.0 /100 | #299 | Tragic 32.9% |
| Immigrants | Argentina | 0.0 /100 | #300 | Tragic 32.9% |
| Okinawans | 0.0 /100 | #301 | Tragic 32.8% |
| Belizeans | 0.0 /100 | #302 | Tragic 32.8% |
| Immigrants | Dominica | 0.0 /100 | #303 | Tragic 32.5% |
| Israelis | 0.0 /100 | #304 | Tragic 32.4% |
| Nicaraguans | 0.0 /100 | #305 | Tragic 32.4% |
| Spanish American Indians | 0.0 /100 | #306 | Tragic 32.4% |
| Immigrants | Jamaica | 0.0 /100 | #307 | Tragic 32.2% |
| Navajo | 0.0 /100 | #308 | Tragic 32.1% |
| Immigrants | Eastern Asia | 0.0 /100 | #309 | Tragic 32.0% |
| Immigrants | Iran | 0.0 /100 | #310 | Tragic 32.0% |
| Indians (Asian) | 0.0 /100 | #311 | Tragic 31.9% |
| Immigrants | Belize | 0.0 /100 | #312 | Tragic 31.8% |
| Hopi | 0.0 /100 | #313 | Tragic 31.8% |
Demographics Similar to Pima by In Labor Force | Age 16-19
In terms of in labor force | age 16-19, the demographic groups most similar to Pima are Immigrants from Russia (34.1%, a difference of 0.050%), Central American Indian (34.1%, a difference of 0.050%), Asian (34.1%, a difference of 0.070%), Immigrants from Asia (34.1%, a difference of 0.080%), and Immigrants from Peru (34.2%, a difference of 0.20%).
| Demographics | Rating | Rank | In Labor Force | Age 16-19 |
| Hispanics or Latinos | 1.1 /100 | #262 | Tragic 34.5% |
| Burmese | 1.1 /100 | #263 | Tragic 34.5% |
| Immigrants | Uruguay | 0.9 /100 | #264 | Tragic 34.4% |
| Immigrants | El Salvador | 0.7 /100 | #265 | Tragic 34.3% |
| Immigrants | Malaysia | 0.7 /100 | #266 | Tragic 34.3% |
| Immigrants | Peru | 0.5 /100 | #267 | Tragic 34.2% |
| Immigrants | Asia | 0.5 /100 | #268 | Tragic 34.1% |
| Pima | 0.5 /100 | #269 | Tragic 34.1% |
| Immigrants | Russia | 0.4 /100 | #270 | Tragic 34.1% |
| Central American Indians | 0.4 /100 | #271 | Tragic 34.1% |
| Asians | 0.4 /100 | #272 | Tragic 34.1% |
| Immigrants | Panama | 0.4 /100 | #273 | Tragic 34.0% |
| Venezuelans | 0.3 /100 | #274 | Tragic 34.0% |
| Immigrants | Fiji | 0.3 /100 | #275 | Tragic 33.9% |
| Immigrants | Latin America | 0.3 /100 | #276 | Tragic 33.9% |