British West Indian vs Immigrants from England In Labor Force | Age 16-19
COMPARE
British West Indian
Immigrants from England
In Labor Force | Age 16-19
In Labor Force | Age 16-19 Comparison
British West Indians
Immigrants from England
29.1%
IN LABOR FORCE | AGE 16-19
0.0/ 100
METRIC RATING
340th/ 347
METRIC RANK
38.1%
IN LABOR FORCE | AGE 16-19
96.4/ 100
METRIC RATING
124th/ 347
METRIC RANK
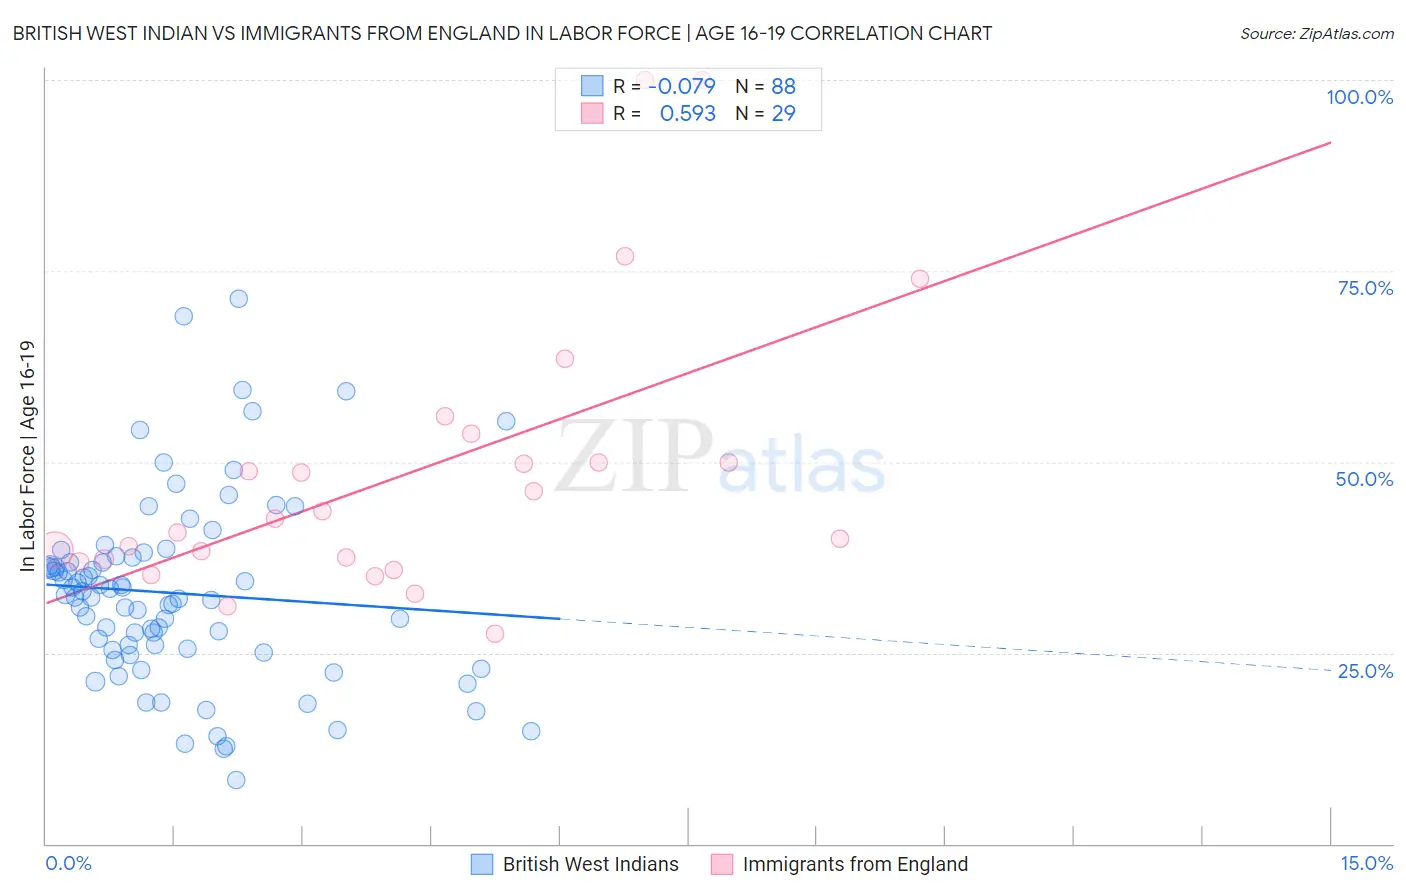
British West Indian vs Immigrants from England In Labor Force | Age 16-19 Correlation Chart
The statistical analysis conducted on geographies consisting of 152,607,678 people shows a slight negative correlation between the proportion of British West Indians and labor force participation rate among population between the ages 16 and 19 in the United States with a correlation coefficient (R) of -0.079 and weighted average of 29.1%. Similarly, the statistical analysis conducted on geographies consisting of 391,103,684 people shows a substantial positive correlation between the proportion of Immigrants from England and labor force participation rate among population between the ages 16 and 19 in the United States with a correlation coefficient (R) of 0.593 and weighted average of 38.1%, a difference of 30.9%.
In Labor Force | Age 16-19 Correlation Summary
| Measurement | British West Indian | Immigrants from England |
| Minimum | 8.4% | 27.4% |
| Maximum | 71.4% | 100.0% |
| Range | 63.0% | 72.6% |
| Mean | 32.8% | 48.6% |
| Median | 32.5% | 42.5% |
| Interquartile 25% (IQ1) | 25.4% | 37.1% |
| Interquartile 75% (IQ3) | 37.2% | 51.9% |
| Interquartile Range (IQR) | 11.7% | 14.8% |
| Standard Deviation (Sample) | 12.1% | 18.4% |
| Standard Deviation (Population) | 12.0% | 18.1% |
Similar Demographics by In Labor Force | Age 16-19
Demographics Similar to British West Indians by In Labor Force | Age 16-19
In terms of in labor force | age 16-19, the demographic groups most similar to British West Indians are Immigrants from Uzbekistan (29.2%, a difference of 0.20%), Immigrants from Armenia (29.0%, a difference of 0.23%), Immigrants from Barbados (29.0%, a difference of 0.38%), Vietnamese (29.6%, a difference of 1.6%), and Immigrants from Bangladesh (30.0%, a difference of 3.3%).
| Demographics | Rating | Rank | In Labor Force | Age 16-19 |
| Immigrants | Hong Kong | 0.0 /100 | #333 | Tragic 30.5% |
| Puerto Ricans | 0.0 /100 | #334 | Tragic 30.3% |
| Immigrants | Cuba | 0.0 /100 | #335 | Tragic 30.2% |
| Immigrants | Trinidad and Tobago | 0.0 /100 | #336 | Tragic 30.2% |
| Immigrants | Bangladesh | 0.0 /100 | #337 | Tragic 30.0% |
| Vietnamese | 0.0 /100 | #338 | Tragic 29.6% |
| Immigrants | Uzbekistan | 0.0 /100 | #339 | Tragic 29.2% |
| British West Indians | 0.0 /100 | #340 | Tragic 29.1% |
| Immigrants | Armenia | 0.0 /100 | #341 | Tragic 29.0% |
| Immigrants | Barbados | 0.0 /100 | #342 | Tragic 29.0% |
| Yuman | 0.0 /100 | #343 | Tragic 27.7% |
| Guyanese | 0.0 /100 | #344 | Tragic 27.4% |
| Immigrants | Guyana | 0.0 /100 | #345 | Tragic 27.3% |
| Immigrants | St. Vincent and the Grenadines | 0.0 /100 | #346 | Tragic 26.3% |
| Immigrants | Grenada | 0.0 /100 | #347 | Tragic 25.4% |
Demographics Similar to Immigrants from England by In Labor Force | Age 16-19
In terms of in labor force | age 16-19, the demographic groups most similar to Immigrants from England are Seminole (38.1%, a difference of 0.080%), Immigrants from Africa (38.0%, a difference of 0.10%), African (38.0%, a difference of 0.26%), Choctaw (38.0%, a difference of 0.27%), and New Zealander (38.0%, a difference of 0.27%).
| Demographics | Rating | Rank | In Labor Force | Age 16-19 |
| Chickasaw | 97.8 /100 | #117 | Exceptional 38.3% |
| Immigrants | Nepal | 97.8 /100 | #118 | Exceptional 38.3% |
| Assyrians/Chaldeans/Syriacs | 97.8 /100 | #119 | Exceptional 38.3% |
| Ukrainians | 97.6 /100 | #120 | Exceptional 38.3% |
| Ethiopians | 97.4 /100 | #121 | Exceptional 38.2% |
| Guamanians/Chamorros | 97.4 /100 | #122 | Exceptional 38.2% |
| Seminole | 96.7 /100 | #123 | Exceptional 38.1% |
| Immigrants | England | 96.4 /100 | #124 | Exceptional 38.1% |
| Immigrants | Africa | 96.1 /100 | #125 | Exceptional 38.0% |
| Africans | 95.6 /100 | #126 | Exceptional 38.0% |
| Choctaw | 95.6 /100 | #127 | Exceptional 38.0% |
| New Zealanders | 95.6 /100 | #128 | Exceptional 38.0% |
| Spaniards | 95.5 /100 | #129 | Exceptional 38.0% |
| Immigrants | Zimbabwe | 95.4 /100 | #130 | Exceptional 38.0% |
| Immigrants | Austria | 95.0 /100 | #131 | Exceptional 37.9% |