Spanish American Indian vs Costa Rican In Labor Force | Age 45-54
COMPARE
Spanish American Indian
Costa Rican
In Labor Force | Age 45-54
In Labor Force | Age 45-54 Comparison
Spanish American Indians
Costa Ricans
80.2%
IN LABOR FORCE | AGE 45-54
0.0/ 100
METRIC RATING
301st/ 347
METRIC RANK
82.8%
IN LABOR FORCE | AGE 45-54
50.0/ 100
METRIC RATING
174th/ 347
METRIC RANK
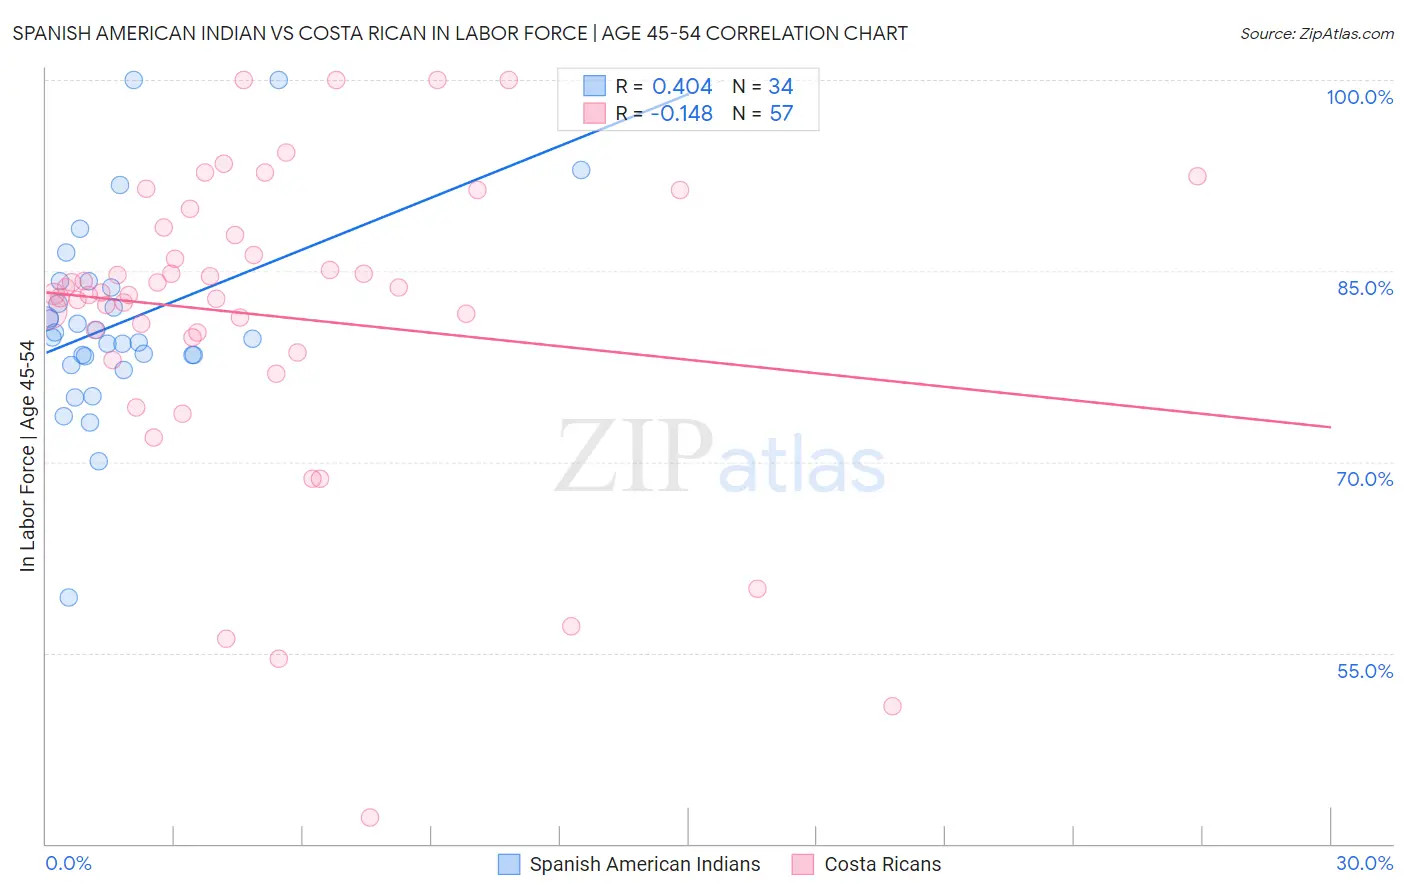
Spanish American Indian vs Costa Rican In Labor Force | Age 45-54 Correlation Chart
The statistical analysis conducted on geographies consisting of 73,137,162 people shows a moderate positive correlation between the proportion of Spanish American Indians and labor force participation rate among population between the ages 45 and 54 in the United States with a correlation coefficient (R) of 0.404 and weighted average of 80.2%. Similarly, the statistical analysis conducted on geographies consisting of 253,468,855 people shows a poor negative correlation between the proportion of Costa Ricans and labor force participation rate among population between the ages 45 and 54 in the United States with a correlation coefficient (R) of -0.148 and weighted average of 82.8%, a difference of 3.1%.
In Labor Force | Age 45-54 Correlation Summary
| Measurement | Spanish American Indian | Costa Rican |
| Minimum | 59.4% | 42.1% |
| Maximum | 100.0% | 100.0% |
| Range | 40.6% | 57.9% |
| Mean | 80.9% | 81.5% |
| Median | 79.7% | 83.2% |
| Interquartile 25% (IQ1) | 78.3% | 79.2% |
| Interquartile 75% (IQ3) | 83.7% | 88.1% |
| Interquartile Range (IQR) | 5.4% | 8.9% |
| Standard Deviation (Sample) | 7.7% | 12.1% |
| Standard Deviation (Population) | 7.6% | 12.0% |
Similar Demographics by In Labor Force | Age 45-54
Demographics Similar to Spanish American Indians by In Labor Force | Age 45-54
In terms of in labor force | age 45-54, the demographic groups most similar to Spanish American Indians are Fijian (80.2%, a difference of 0.010%), Dominican (80.3%, a difference of 0.020%), Immigrants from Central America (80.2%, a difference of 0.080%), Marshallese (80.3%, a difference of 0.13%), and Immigrants from the Azores (80.1%, a difference of 0.14%).
| Demographics | Rating | Rank | In Labor Force | Age 45-54 |
| Yakama | 0.0 /100 | #294 | Tragic 80.6% |
| Nepalese | 0.0 /100 | #295 | Tragic 80.5% |
| Africans | 0.0 /100 | #296 | Tragic 80.5% |
| Americans | 0.0 /100 | #297 | Tragic 80.4% |
| Marshallese | 0.0 /100 | #298 | Tragic 80.3% |
| Dominicans | 0.0 /100 | #299 | Tragic 80.3% |
| Fijians | 0.0 /100 | #300 | Tragic 80.2% |
| Spanish American Indians | 0.0 /100 | #301 | Tragic 80.2% |
| Immigrants | Central America | 0.0 /100 | #302 | Tragic 80.2% |
| Immigrants | Azores | 0.0 /100 | #303 | Tragic 80.1% |
| Hispanics or Latinos | 0.0 /100 | #304 | Tragic 80.1% |
| Immigrants | Dominican Republic | 0.0 /100 | #305 | Tragic 80.1% |
| Spanish Americans | 0.0 /100 | #306 | Tragic 80.1% |
| Blackfeet | 0.0 /100 | #307 | Tragic 80.0% |
| Central American Indians | 0.0 /100 | #308 | Tragic 80.0% |
Demographics Similar to Costa Ricans by In Labor Force | Age 45-54
In terms of in labor force | age 45-54, the demographic groups most similar to Costa Ricans are Nicaraguan (82.8%, a difference of 0.0%), Icelander (82.8%, a difference of 0.020%), Immigrants from Liberia (82.7%, a difference of 0.020%), Pakistani (82.8%, a difference of 0.030%), and Immigrants from Zaire (82.8%, a difference of 0.030%).
| Demographics | Rating | Rank | In Labor Force | Age 45-54 |
| Swiss | 56.5 /100 | #167 | Average 82.8% |
| Immigrants | South Africa | 55.8 /100 | #168 | Average 82.8% |
| Immigrants | Western Africa | 54.1 /100 | #169 | Average 82.8% |
| Pakistanis | 53.2 /100 | #170 | Average 82.8% |
| Immigrants | Zaire | 52.9 /100 | #171 | Average 82.8% |
| Icelanders | 51.8 /100 | #172 | Average 82.8% |
| Nicaraguans | 50.3 /100 | #173 | Average 82.8% |
| Costa Ricans | 50.0 /100 | #174 | Average 82.8% |
| Immigrants | Liberia | 47.9 /100 | #175 | Average 82.7% |
| Northern Europeans | 46.9 /100 | #176 | Average 82.7% |
| Immigrants | Nicaragua | 44.6 /100 | #177 | Average 82.7% |
| Nigerians | 40.5 /100 | #178 | Average 82.7% |
| Immigrants | Switzerland | 39.4 /100 | #179 | Fair 82.7% |
| Hungarians | 38.0 /100 | #180 | Fair 82.7% |
| Israelis | 37.7 /100 | #181 | Fair 82.7% |