Spanish American Indian vs Ugandan In Labor Force | Age 45-54
COMPARE
Spanish American Indian
Ugandan
In Labor Force | Age 45-54
In Labor Force | Age 45-54 Comparison
Spanish American Indians
Ugandans
80.2%
IN LABOR FORCE | AGE 45-54
0.0/ 100
METRIC RATING
301st/ 347
METRIC RANK
83.7%
IN LABOR FORCE | AGE 45-54
99.5/ 100
METRIC RATING
36th/ 347
METRIC RANK
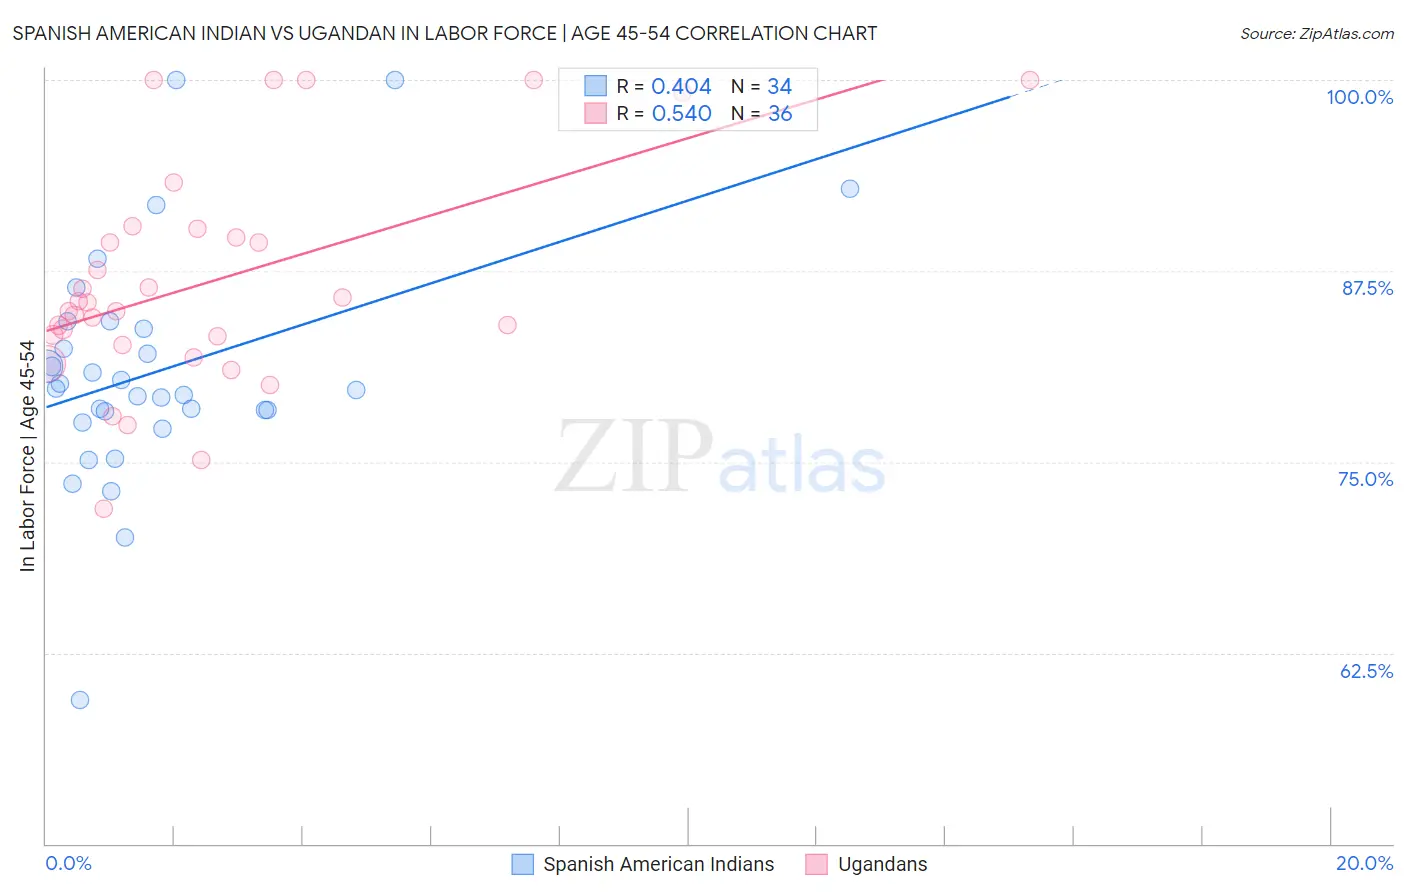
Spanish American Indian vs Ugandan In Labor Force | Age 45-54 Correlation Chart
The statistical analysis conducted on geographies consisting of 73,137,162 people shows a moderate positive correlation between the proportion of Spanish American Indians and labor force participation rate among population between the ages 45 and 54 in the United States with a correlation coefficient (R) of 0.404 and weighted average of 80.2%. Similarly, the statistical analysis conducted on geographies consisting of 93,996,465 people shows a substantial positive correlation between the proportion of Ugandans and labor force participation rate among population between the ages 45 and 54 in the United States with a correlation coefficient (R) of 0.540 and weighted average of 83.7%, a difference of 4.3%.
In Labor Force | Age 45-54 Correlation Summary
| Measurement | Spanish American Indian | Ugandan |
| Minimum | 59.4% | 71.9% |
| Maximum | 100.0% | 100.0% |
| Range | 40.6% | 28.1% |
| Mean | 80.9% | 86.8% |
| Median | 79.7% | 85.1% |
| Interquartile 25% (IQ1) | 78.3% | 82.9% |
| Interquartile 75% (IQ3) | 83.7% | 90.0% |
| Interquartile Range (IQR) | 5.4% | 7.1% |
| Standard Deviation (Sample) | 7.7% | 7.3% |
| Standard Deviation (Population) | 7.6% | 7.2% |
Similar Demographics by In Labor Force | Age 45-54
Demographics Similar to Spanish American Indians by In Labor Force | Age 45-54
In terms of in labor force | age 45-54, the demographic groups most similar to Spanish American Indians are Fijian (80.2%, a difference of 0.010%), Dominican (80.3%, a difference of 0.020%), Immigrants from Central America (80.2%, a difference of 0.080%), Marshallese (80.3%, a difference of 0.13%), and Immigrants from the Azores (80.1%, a difference of 0.14%).
| Demographics | Rating | Rank | In Labor Force | Age 45-54 |
| Yakama | 0.0 /100 | #294 | Tragic 80.6% |
| Nepalese | 0.0 /100 | #295 | Tragic 80.5% |
| Africans | 0.0 /100 | #296 | Tragic 80.5% |
| Americans | 0.0 /100 | #297 | Tragic 80.4% |
| Marshallese | 0.0 /100 | #298 | Tragic 80.3% |
| Dominicans | 0.0 /100 | #299 | Tragic 80.3% |
| Fijians | 0.0 /100 | #300 | Tragic 80.2% |
| Spanish American Indians | 0.0 /100 | #301 | Tragic 80.2% |
| Immigrants | Central America | 0.0 /100 | #302 | Tragic 80.2% |
| Immigrants | Azores | 0.0 /100 | #303 | Tragic 80.1% |
| Hispanics or Latinos | 0.0 /100 | #304 | Tragic 80.1% |
| Immigrants | Dominican Republic | 0.0 /100 | #305 | Tragic 80.1% |
| Spanish Americans | 0.0 /100 | #306 | Tragic 80.1% |
| Blackfeet | 0.0 /100 | #307 | Tragic 80.0% |
| Central American Indians | 0.0 /100 | #308 | Tragic 80.0% |
Demographics Similar to Ugandans by In Labor Force | Age 45-54
In terms of in labor force | age 45-54, the demographic groups most similar to Ugandans are Kenyan (83.7%, a difference of 0.0%), Brazilian (83.7%, a difference of 0.0%), Swedish (83.7%, a difference of 0.020%), Immigrants from Venezuela (83.7%, a difference of 0.040%), and Immigrants from Cuba (83.7%, a difference of 0.040%).
| Demographics | Rating | Rank | In Labor Force | Age 45-54 |
| Immigrants | Pakistan | 99.7 /100 | #29 | Exceptional 83.8% |
| Immigrants | Bulgaria | 99.7 /100 | #30 | Exceptional 83.8% |
| Immigrants | Eritrea | 99.7 /100 | #31 | Exceptional 83.8% |
| Turks | 99.7 /100 | #32 | Exceptional 83.8% |
| Latvians | 99.7 /100 | #33 | Exceptional 83.8% |
| Kenyans | 99.5 /100 | #34 | Exceptional 83.7% |
| Brazilians | 99.5 /100 | #35 | Exceptional 83.7% |
| Ugandans | 99.5 /100 | #36 | Exceptional 83.7% |
| Swedes | 99.4 /100 | #37 | Exceptional 83.7% |
| Immigrants | Venezuela | 99.4 /100 | #38 | Exceptional 83.7% |
| Immigrants | Cuba | 99.4 /100 | #39 | Exceptional 83.7% |
| Immigrants | Uganda | 99.4 /100 | #40 | Exceptional 83.7% |
| Immigrants | Korea | 99.3 /100 | #41 | Exceptional 83.7% |
| Immigrants | Moldova | 99.3 /100 | #42 | Exceptional 83.7% |
| Venezuelans | 99.2 /100 | #43 | Exceptional 83.6% |