Spanish American Indian vs Immigrants from Sri Lanka In Labor Force | Age 45-54
COMPARE
Spanish American Indian
Immigrants from Sri Lanka
In Labor Force | Age 45-54
In Labor Force | Age 45-54 Comparison
Spanish American Indians
Immigrants from Sri Lanka
80.2%
IN LABOR FORCE | AGE 45-54
0.0/ 100
METRIC RATING
301st/ 347
METRIC RANK
83.9%
IN LABOR FORCE | AGE 45-54
99.8/ 100
METRIC RATING
21st/ 347
METRIC RANK
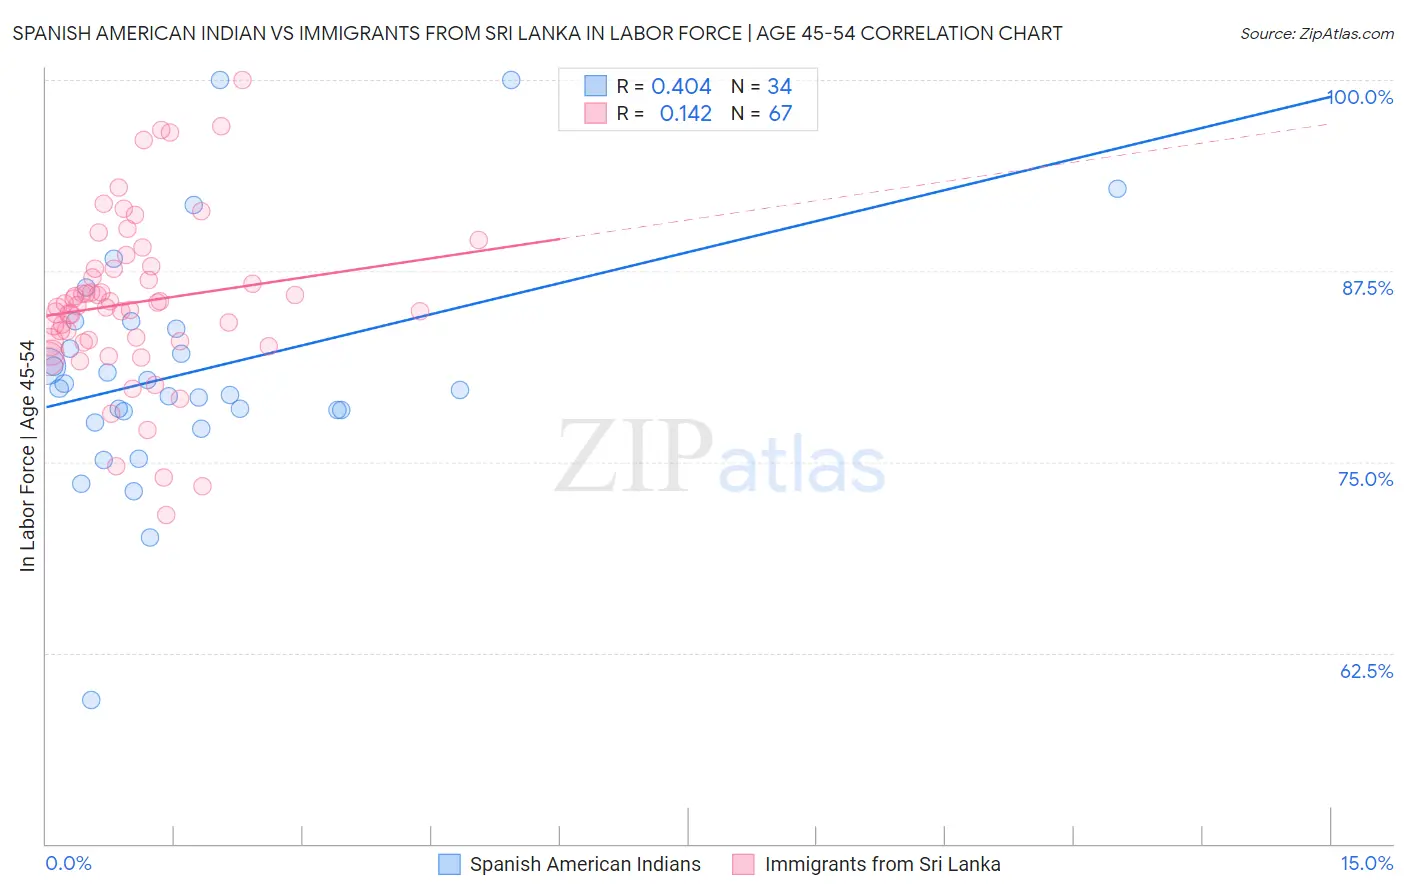
Spanish American Indian vs Immigrants from Sri Lanka In Labor Force | Age 45-54 Correlation Chart
The statistical analysis conducted on geographies consisting of 73,137,162 people shows a moderate positive correlation between the proportion of Spanish American Indians and labor force participation rate among population between the ages 45 and 54 in the United States with a correlation coefficient (R) of 0.404 and weighted average of 80.2%. Similarly, the statistical analysis conducted on geographies consisting of 149,657,644 people shows a poor positive correlation between the proportion of Immigrants from Sri Lanka and labor force participation rate among population between the ages 45 and 54 in the United States with a correlation coefficient (R) of 0.142 and weighted average of 83.9%, a difference of 4.6%.
In Labor Force | Age 45-54 Correlation Summary
| Measurement | Spanish American Indian | Immigrants from Sri Lanka |
| Minimum | 59.4% | 71.5% |
| Maximum | 100.0% | 100.0% |
| Range | 40.6% | 28.5% |
| Mean | 80.9% | 85.4% |
| Median | 79.7% | 85.2% |
| Interquartile 25% (IQ1) | 78.3% | 82.8% |
| Interquartile 75% (IQ3) | 83.7% | 87.6% |
| Interquartile Range (IQR) | 5.4% | 4.8% |
| Standard Deviation (Sample) | 7.7% | 5.4% |
| Standard Deviation (Population) | 7.6% | 5.4% |
Similar Demographics by In Labor Force | Age 45-54
Demographics Similar to Spanish American Indians by In Labor Force | Age 45-54
In terms of in labor force | age 45-54, the demographic groups most similar to Spanish American Indians are Fijian (80.2%, a difference of 0.010%), Dominican (80.3%, a difference of 0.020%), Immigrants from Central America (80.2%, a difference of 0.080%), Marshallese (80.3%, a difference of 0.13%), and Immigrants from the Azores (80.1%, a difference of 0.14%).
| Demographics | Rating | Rank | In Labor Force | Age 45-54 |
| Yakama | 0.0 /100 | #294 | Tragic 80.6% |
| Nepalese | 0.0 /100 | #295 | Tragic 80.5% |
| Africans | 0.0 /100 | #296 | Tragic 80.5% |
| Americans | 0.0 /100 | #297 | Tragic 80.4% |
| Marshallese | 0.0 /100 | #298 | Tragic 80.3% |
| Dominicans | 0.0 /100 | #299 | Tragic 80.3% |
| Fijians | 0.0 /100 | #300 | Tragic 80.2% |
| Spanish American Indians | 0.0 /100 | #301 | Tragic 80.2% |
| Immigrants | Central America | 0.0 /100 | #302 | Tragic 80.2% |
| Immigrants | Azores | 0.0 /100 | #303 | Tragic 80.1% |
| Hispanics or Latinos | 0.0 /100 | #304 | Tragic 80.1% |
| Immigrants | Dominican Republic | 0.0 /100 | #305 | Tragic 80.1% |
| Spanish Americans | 0.0 /100 | #306 | Tragic 80.1% |
| Blackfeet | 0.0 /100 | #307 | Tragic 80.0% |
| Central American Indians | 0.0 /100 | #308 | Tragic 80.0% |
Demographics Similar to Immigrants from Sri Lanka by In Labor Force | Age 45-54
In terms of in labor force | age 45-54, the demographic groups most similar to Immigrants from Sri Lanka are Immigrants from Eastern Africa (83.9%, a difference of 0.0%), Immigrants from Ireland (83.9%, a difference of 0.0%), Czech (83.9%, a difference of 0.010%), Tlingit-Haida (83.9%, a difference of 0.010%), and Slovene (83.9%, a difference of 0.010%).
| Demographics | Rating | Rank | In Labor Force | Age 45-54 |
| Cambodians | 99.9 /100 | #14 | Exceptional 84.1% |
| Cypriots | 99.9 /100 | #15 | Exceptional 84.1% |
| Immigrants | Nepal | 99.9 /100 | #16 | Exceptional 84.0% |
| Zimbabweans | 99.9 /100 | #17 | Exceptional 84.0% |
| Immigrants | South Central Asia | 99.9 /100 | #18 | Exceptional 84.0% |
| Czechs | 99.8 /100 | #19 | Exceptional 83.9% |
| Immigrants | Eastern Africa | 99.8 /100 | #20 | Exceptional 83.9% |
| Immigrants | Sri Lanka | 99.8 /100 | #21 | Exceptional 83.9% |
| Immigrants | Ireland | 99.8 /100 | #22 | Exceptional 83.9% |
| Tlingit-Haida | 99.8 /100 | #23 | Exceptional 83.9% |
| Slovenes | 99.8 /100 | #24 | Exceptional 83.9% |
| Immigrants | North Macedonia | 99.8 /100 | #25 | Exceptional 83.9% |
| Immigrants | Serbia | 99.8 /100 | #26 | Exceptional 83.9% |
| Immigrants | Brazil | 99.8 /100 | #27 | Exceptional 83.9% |
| Immigrants | Lithuania | 99.8 /100 | #28 | Exceptional 83.9% |