Spanish American Indian vs Russian In Labor Force | Age 45-54
COMPARE
Spanish American Indian
Russian
In Labor Force | Age 45-54
In Labor Force | Age 45-54 Comparison
Spanish American Indians
Russians
80.2%
IN LABOR FORCE | AGE 45-54
0.0/ 100
METRIC RATING
301st/ 347
METRIC RANK
83.4%
IN LABOR FORCE | AGE 45-54
96.8/ 100
METRIC RATING
76th/ 347
METRIC RANK
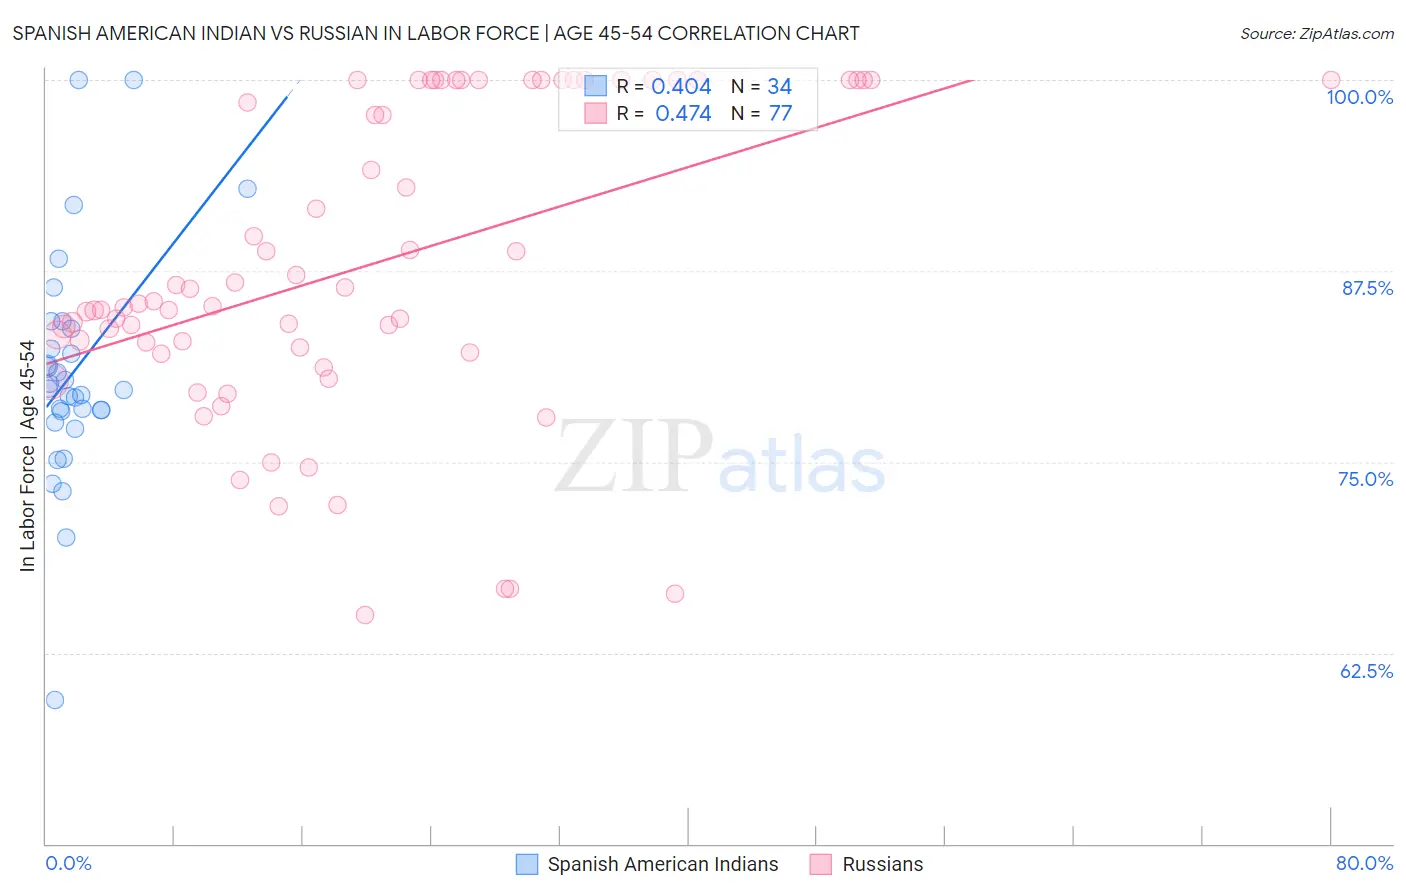
Spanish American Indian vs Russian In Labor Force | Age 45-54 Correlation Chart
The statistical analysis conducted on geographies consisting of 73,137,162 people shows a moderate positive correlation between the proportion of Spanish American Indians and labor force participation rate among population between the ages 45 and 54 in the United States with a correlation coefficient (R) of 0.404 and weighted average of 80.2%. Similarly, the statistical analysis conducted on geographies consisting of 511,675,657 people shows a moderate positive correlation between the proportion of Russians and labor force participation rate among population between the ages 45 and 54 in the United States with a correlation coefficient (R) of 0.474 and weighted average of 83.4%, a difference of 3.9%.
In Labor Force | Age 45-54 Correlation Summary
| Measurement | Spanish American Indian | Russian |
| Minimum | 59.4% | 65.0% |
| Maximum | 100.0% | 100.0% |
| Range | 40.6% | 35.0% |
| Mean | 80.9% | 87.8% |
| Median | 79.7% | 85.3% |
| Interquartile 25% (IQ1) | 78.3% | 82.3% |
| Interquartile 75% (IQ3) | 83.7% | 100.0% |
| Interquartile Range (IQR) | 5.4% | 17.7% |
| Standard Deviation (Sample) | 7.7% | 9.9% |
| Standard Deviation (Population) | 7.6% | 9.9% |
Similar Demographics by In Labor Force | Age 45-54
Demographics Similar to Spanish American Indians by In Labor Force | Age 45-54
In terms of in labor force | age 45-54, the demographic groups most similar to Spanish American Indians are Fijian (80.2%, a difference of 0.010%), Dominican (80.3%, a difference of 0.020%), Immigrants from Central America (80.2%, a difference of 0.080%), Marshallese (80.3%, a difference of 0.13%), and Immigrants from the Azores (80.1%, a difference of 0.14%).
| Demographics | Rating | Rank | In Labor Force | Age 45-54 |
| Yakama | 0.0 /100 | #294 | Tragic 80.6% |
| Nepalese | 0.0 /100 | #295 | Tragic 80.5% |
| Africans | 0.0 /100 | #296 | Tragic 80.5% |
| Americans | 0.0 /100 | #297 | Tragic 80.4% |
| Marshallese | 0.0 /100 | #298 | Tragic 80.3% |
| Dominicans | 0.0 /100 | #299 | Tragic 80.3% |
| Fijians | 0.0 /100 | #300 | Tragic 80.2% |
| Spanish American Indians | 0.0 /100 | #301 | Tragic 80.2% |
| Immigrants | Central America | 0.0 /100 | #302 | Tragic 80.2% |
| Immigrants | Azores | 0.0 /100 | #303 | Tragic 80.1% |
| Hispanics or Latinos | 0.0 /100 | #304 | Tragic 80.1% |
| Immigrants | Dominican Republic | 0.0 /100 | #305 | Tragic 80.1% |
| Spanish Americans | 0.0 /100 | #306 | Tragic 80.1% |
| Blackfeet | 0.0 /100 | #307 | Tragic 80.0% |
| Central American Indians | 0.0 /100 | #308 | Tragic 80.0% |
Demographics Similar to Russians by In Labor Force | Age 45-54
In terms of in labor force | age 45-54, the demographic groups most similar to Russians are Immigrants from Somalia (83.4%, a difference of 0.0%), Estonian (83.4%, a difference of 0.0%), Cuban (83.4%, a difference of 0.010%), Immigrants from Egypt (83.4%, a difference of 0.010%), and Serbian (83.4%, a difference of 0.020%).
| Demographics | Rating | Rank | In Labor Force | Age 45-54 |
| Taiwanese | 97.5 /100 | #69 | Exceptional 83.4% |
| Immigrants | Latvia | 97.4 /100 | #70 | Exceptional 83.4% |
| Colombians | 97.3 /100 | #71 | Exceptional 83.4% |
| Serbians | 97.2 /100 | #72 | Exceptional 83.4% |
| Immigrants | Czechoslovakia | 97.1 /100 | #73 | Exceptional 83.4% |
| Immigrants | Somalia | 96.9 /100 | #74 | Exceptional 83.4% |
| Estonians | 96.9 /100 | #75 | Exceptional 83.4% |
| Russians | 96.8 /100 | #76 | Exceptional 83.4% |
| Cubans | 96.7 /100 | #77 | Exceptional 83.4% |
| Immigrants | Egypt | 96.6 /100 | #78 | Exceptional 83.4% |
| Belgians | 96.5 /100 | #79 | Exceptional 83.4% |
| Immigrants | Croatia | 96.5 /100 | #80 | Exceptional 83.4% |
| Jordanians | 96.4 /100 | #81 | Exceptional 83.4% |
| Immigrants | Eastern Asia | 96.3 /100 | #82 | Exceptional 83.4% |
| Immigrants | Zimbabwe | 96.3 /100 | #83 | Exceptional 83.4% |