Hopi vs Costa Rican In Labor Force | Age 45-54
COMPARE
Hopi
Costa Rican
In Labor Force | Age 45-54
In Labor Force | Age 45-54 Comparison
Hopi
Costa Ricans
75.0%
IN LABOR FORCE | AGE 45-54
0.0/ 100
METRIC RATING
343rd/ 347
METRIC RANK
82.8%
IN LABOR FORCE | AGE 45-54
50.0/ 100
METRIC RATING
174th/ 347
METRIC RANK
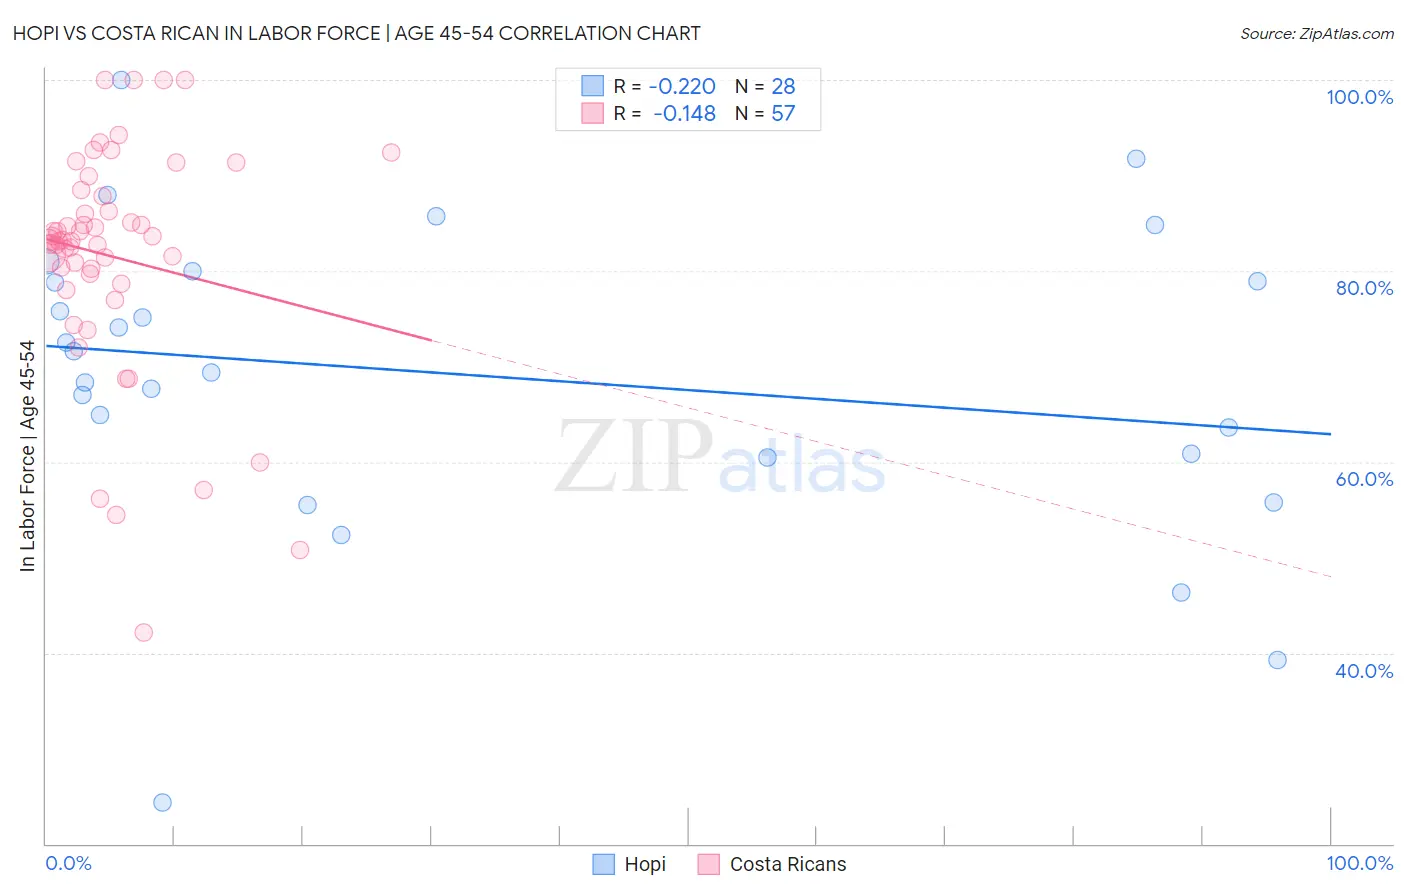
Hopi vs Costa Rican In Labor Force | Age 45-54 Correlation Chart
The statistical analysis conducted on geographies consisting of 74,732,664 people shows a weak negative correlation between the proportion of Hopi and labor force participation rate among population between the ages 45 and 54 in the United States with a correlation coefficient (R) of -0.220 and weighted average of 75.0%. Similarly, the statistical analysis conducted on geographies consisting of 253,468,855 people shows a poor negative correlation between the proportion of Costa Ricans and labor force participation rate among population between the ages 45 and 54 in the United States with a correlation coefficient (R) of -0.148 and weighted average of 82.8%, a difference of 10.3%.
In Labor Force | Age 45-54 Correlation Summary
| Measurement | Hopi | Costa Rican |
| Minimum | 24.3% | 42.1% |
| Maximum | 100.0% | 100.0% |
| Range | 75.7% | 57.9% |
| Mean | 69.1% | 81.5% |
| Median | 70.4% | 83.2% |
| Interquartile 25% (IQ1) | 60.7% | 79.2% |
| Interquartile 75% (IQ3) | 79.4% | 88.1% |
| Interquartile Range (IQR) | 18.8% | 8.9% |
| Standard Deviation (Sample) | 16.3% | 12.1% |
| Standard Deviation (Population) | 16.0% | 12.0% |
Similar Demographics by In Labor Force | Age 45-54
Demographics Similar to Hopi by In Labor Force | Age 45-54
In terms of in labor force | age 45-54, the demographic groups most similar to Hopi are Tohono O'odham (75.1%, a difference of 0.18%), Pueblo (75.5%, a difference of 0.67%), Immigrants from Yemen (74.4%, a difference of 0.78%), Lumbee (75.6%, a difference of 0.79%), and Puerto Rican (75.9%, a difference of 1.3%).
| Demographics | Rating | Rank | In Labor Force | Age 45-54 |
| Natives/Alaskans | 0.0 /100 | #333 | Tragic 77.1% |
| Apache | 0.0 /100 | #334 | Tragic 77.1% |
| Arapaho | 0.0 /100 | #335 | Tragic 77.1% |
| Paiute | 0.0 /100 | #336 | Tragic 76.7% |
| Ute | 0.0 /100 | #337 | Tragic 76.6% |
| Yuman | 0.0 /100 | #338 | Tragic 76.3% |
| Puerto Ricans | 0.0 /100 | #339 | Tragic 75.9% |
| Lumbee | 0.0 /100 | #340 | Tragic 75.6% |
| Pueblo | 0.0 /100 | #341 | Tragic 75.5% |
| Tohono O'odham | 0.0 /100 | #342 | Tragic 75.1% |
| Hopi | 0.0 /100 | #343 | Tragic 75.0% |
| Immigrants | Yemen | 0.0 /100 | #344 | Tragic 74.4% |
| Houma | 0.0 /100 | #345 | Tragic 74.1% |
| Pima | 0.0 /100 | #346 | Tragic 72.8% |
| Navajo | 0.0 /100 | #347 | Tragic 72.8% |
Demographics Similar to Costa Ricans by In Labor Force | Age 45-54
In terms of in labor force | age 45-54, the demographic groups most similar to Costa Ricans are Nicaraguan (82.8%, a difference of 0.0%), Icelander (82.8%, a difference of 0.020%), Immigrants from Liberia (82.7%, a difference of 0.020%), Pakistani (82.8%, a difference of 0.030%), and Immigrants from Zaire (82.8%, a difference of 0.030%).
| Demographics | Rating | Rank | In Labor Force | Age 45-54 |
| Swiss | 56.5 /100 | #167 | Average 82.8% |
| Immigrants | South Africa | 55.8 /100 | #168 | Average 82.8% |
| Immigrants | Western Africa | 54.1 /100 | #169 | Average 82.8% |
| Pakistanis | 53.2 /100 | #170 | Average 82.8% |
| Immigrants | Zaire | 52.9 /100 | #171 | Average 82.8% |
| Icelanders | 51.8 /100 | #172 | Average 82.8% |
| Nicaraguans | 50.3 /100 | #173 | Average 82.8% |
| Costa Ricans | 50.0 /100 | #174 | Average 82.8% |
| Immigrants | Liberia | 47.9 /100 | #175 | Average 82.7% |
| Northern Europeans | 46.9 /100 | #176 | Average 82.7% |
| Immigrants | Nicaragua | 44.6 /100 | #177 | Average 82.7% |
| Nigerians | 40.5 /100 | #178 | Average 82.7% |
| Immigrants | Switzerland | 39.4 /100 | #179 | Fair 82.7% |
| Hungarians | 38.0 /100 | #180 | Fair 82.7% |
| Israelis | 37.7 /100 | #181 | Fair 82.7% |