Bulgarian vs Costa Rican In Labor Force | Age 45-54
COMPARE
Bulgarian
Costa Rican
In Labor Force | Age 45-54
In Labor Force | Age 45-54 Comparison
Bulgarians
Costa Ricans
84.2%
IN LABOR FORCE | AGE 45-54
100.0/ 100
METRIC RATING
12th/ 347
METRIC RANK
82.8%
IN LABOR FORCE | AGE 45-54
50.0/ 100
METRIC RATING
174th/ 347
METRIC RANK
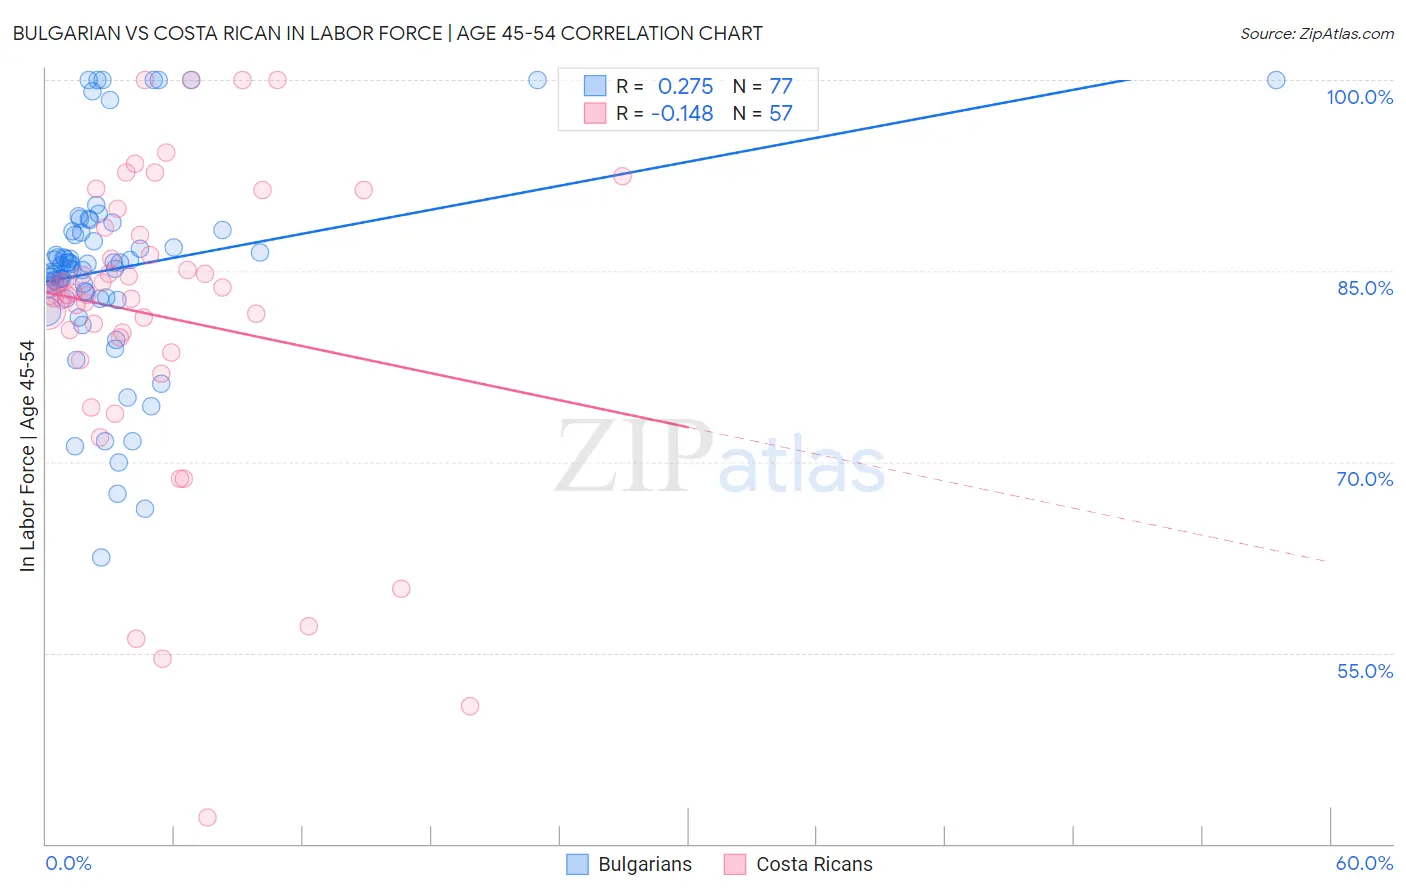
Bulgarian vs Costa Rican In Labor Force | Age 45-54 Correlation Chart
The statistical analysis conducted on geographies consisting of 205,560,159 people shows a weak positive correlation between the proportion of Bulgarians and labor force participation rate among population between the ages 45 and 54 in the United States with a correlation coefficient (R) of 0.275 and weighted average of 84.2%. Similarly, the statistical analysis conducted on geographies consisting of 253,468,855 people shows a poor negative correlation between the proportion of Costa Ricans and labor force participation rate among population between the ages 45 and 54 in the United States with a correlation coefficient (R) of -0.148 and weighted average of 82.8%, a difference of 1.8%.
In Labor Force | Age 45-54 Correlation Summary
| Measurement | Bulgarian | Costa Rican |
| Minimum | 62.5% | 42.1% |
| Maximum | 100.0% | 100.0% |
| Range | 37.5% | 57.9% |
| Mean | 85.2% | 81.5% |
| Median | 85.5% | 83.2% |
| Interquartile 25% (IQ1) | 82.8% | 79.2% |
| Interquartile 75% (IQ3) | 88.1% | 88.1% |
| Interquartile Range (IQR) | 5.2% | 8.9% |
| Standard Deviation (Sample) | 7.9% | 12.1% |
| Standard Deviation (Population) | 7.9% | 12.0% |
Similar Demographics by In Labor Force | Age 45-54
Demographics Similar to Bulgarians by In Labor Force | Age 45-54
In terms of in labor force | age 45-54, the demographic groups most similar to Bulgarians are Thai (84.3%, a difference of 0.11%), Chinese (84.1%, a difference of 0.11%), Cambodian (84.1%, a difference of 0.14%), Norwegian (84.4%, a difference of 0.20%), and Cypriot (84.1%, a difference of 0.20%).
| Demographics | Rating | Rank | In Labor Force | Age 45-54 |
| Ethiopians | 100.0 /100 | #5 | Exceptional 84.8% |
| Immigrants | India | 100.0 /100 | #6 | Exceptional 84.7% |
| Immigrants | Cameroon | 100.0 /100 | #7 | Exceptional 84.6% |
| Sierra Leoneans | 100.0 /100 | #8 | Exceptional 84.5% |
| Immigrants | Sierra Leone | 100.0 /100 | #9 | Exceptional 84.4% |
| Norwegians | 100.0 /100 | #10 | Exceptional 84.4% |
| Thais | 100.0 /100 | #11 | Exceptional 84.3% |
| Bulgarians | 100.0 /100 | #12 | Exceptional 84.2% |
| Chinese | 99.9 /100 | #13 | Exceptional 84.1% |
| Cambodians | 99.9 /100 | #14 | Exceptional 84.1% |
| Cypriots | 99.9 /100 | #15 | Exceptional 84.1% |
| Immigrants | Nepal | 99.9 /100 | #16 | Exceptional 84.0% |
| Zimbabweans | 99.9 /100 | #17 | Exceptional 84.0% |
| Immigrants | South Central Asia | 99.9 /100 | #18 | Exceptional 84.0% |
| Czechs | 99.8 /100 | #19 | Exceptional 83.9% |
Demographics Similar to Costa Ricans by In Labor Force | Age 45-54
In terms of in labor force | age 45-54, the demographic groups most similar to Costa Ricans are Nicaraguan (82.8%, a difference of 0.0%), Icelander (82.8%, a difference of 0.020%), Immigrants from Liberia (82.7%, a difference of 0.020%), Pakistani (82.8%, a difference of 0.030%), and Immigrants from Zaire (82.8%, a difference of 0.030%).
| Demographics | Rating | Rank | In Labor Force | Age 45-54 |
| Swiss | 56.5 /100 | #167 | Average 82.8% |
| Immigrants | South Africa | 55.8 /100 | #168 | Average 82.8% |
| Immigrants | Western Africa | 54.1 /100 | #169 | Average 82.8% |
| Pakistanis | 53.2 /100 | #170 | Average 82.8% |
| Immigrants | Zaire | 52.9 /100 | #171 | Average 82.8% |
| Icelanders | 51.8 /100 | #172 | Average 82.8% |
| Nicaraguans | 50.3 /100 | #173 | Average 82.8% |
| Costa Ricans | 50.0 /100 | #174 | Average 82.8% |
| Immigrants | Liberia | 47.9 /100 | #175 | Average 82.7% |
| Northern Europeans | 46.9 /100 | #176 | Average 82.7% |
| Immigrants | Nicaragua | 44.6 /100 | #177 | Average 82.7% |
| Nigerians | 40.5 /100 | #178 | Average 82.7% |
| Immigrants | Switzerland | 39.4 /100 | #179 | Fair 82.7% |
| Hungarians | 38.0 /100 | #180 | Fair 82.7% |
| Israelis | 37.7 /100 | #181 | Fair 82.7% |