Immigrants from Taiwan vs Carpatho Rusyn In Labor Force | Age 20-64
COMPARE
Immigrants from Taiwan
Carpatho Rusyn
In Labor Force | Age 20-64
In Labor Force | Age 20-64 Comparison
Immigrants from Taiwan
Carpatho Rusyns
80.0%
IN LABOR FORCE | AGE 20-64
92.5/ 100
METRIC RATING
119th/ 347
METRIC RANK
80.3%
IN LABOR FORCE | AGE 20-64
98.8/ 100
METRIC RATING
62nd/ 347
METRIC RANK
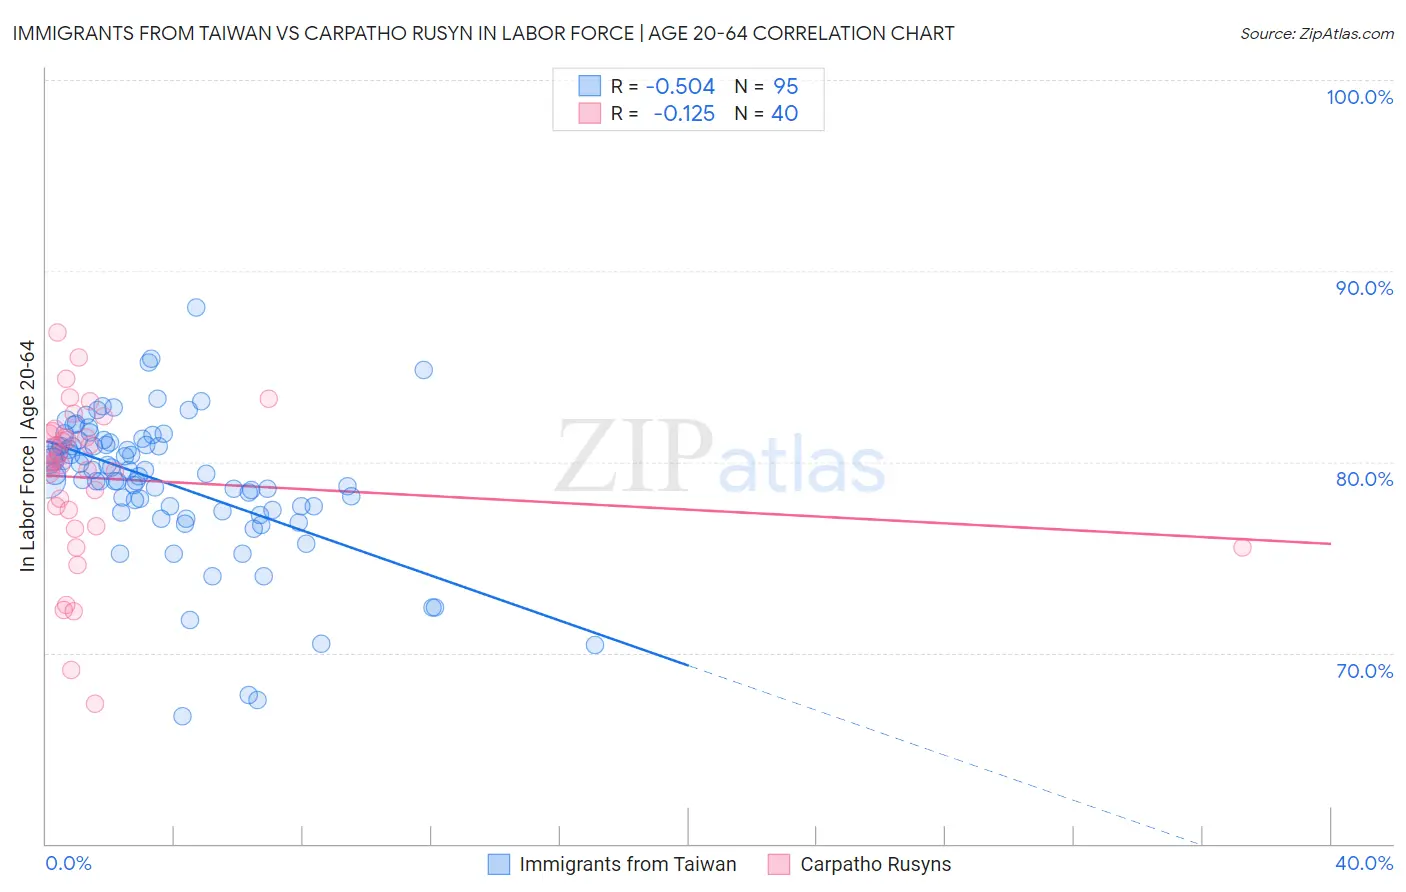
Immigrants from Taiwan vs Carpatho Rusyn In Labor Force | Age 20-64 Correlation Chart
The statistical analysis conducted on geographies consisting of 298,293,135 people shows a substantial negative correlation between the proportion of Immigrants from Taiwan and labor force participation rate among population between the ages 20 and 64 in the United States with a correlation coefficient (R) of -0.504 and weighted average of 80.0%. Similarly, the statistical analysis conducted on geographies consisting of 58,872,065 people shows a poor negative correlation between the proportion of Carpatho Rusyns and labor force participation rate among population between the ages 20 and 64 in the United States with a correlation coefficient (R) of -0.125 and weighted average of 80.3%, a difference of 0.38%.
In Labor Force | Age 20-64 Correlation Summary
| Measurement | Immigrants from Taiwan | Carpatho Rusyn |
| Minimum | 66.7% | 67.3% |
| Maximum | 88.1% | 86.8% |
| Range | 21.4% | 19.5% |
| Mean | 78.9% | 79.1% |
| Median | 79.4% | 80.0% |
| Interquartile 25% (IQ1) | 77.5% | 77.0% |
| Interquartile 75% (IQ3) | 80.9% | 81.6% |
| Interquartile Range (IQR) | 3.4% | 4.5% |
| Standard Deviation (Sample) | 3.7% | 4.2% |
| Standard Deviation (Population) | 3.7% | 4.2% |
Similar Demographics by In Labor Force | Age 20-64
Demographics Similar to Immigrants from Taiwan by In Labor Force | Age 20-64
In terms of in labor force | age 20-64, the demographic groups most similar to Immigrants from Taiwan are Maltese (80.0%, a difference of 0.0%), Immigrants from Vietnam (80.0%, a difference of 0.010%), Cape Verdean (80.0%, a difference of 0.010%), Immigrants from Kuwait (80.0%, a difference of 0.010%), and Mongolian (79.9%, a difference of 0.010%).
| Demographics | Rating | Rank | In Labor Force | Age 20-64 |
| Immigrants | Italy | 93.9 /100 | #112 | Exceptional 80.0% |
| Sri Lankans | 93.9 /100 | #113 | Exceptional 80.0% |
| Argentineans | 93.8 /100 | #114 | Exceptional 80.0% |
| Bermudans | 93.3 /100 | #115 | Exceptional 80.0% |
| Immigrants | Western Africa | 93.1 /100 | #116 | Exceptional 80.0% |
| Immigrants | Vietnam | 92.7 /100 | #117 | Exceptional 80.0% |
| Cape Verdeans | 92.7 /100 | #118 | Exceptional 80.0% |
| Immigrants | Taiwan | 92.5 /100 | #119 | Exceptional 80.0% |
| Maltese | 92.4 /100 | #120 | Exceptional 80.0% |
| Immigrants | Kuwait | 92.2 /100 | #121 | Exceptional 80.0% |
| Mongolians | 92.0 /100 | #122 | Exceptional 79.9% |
| Immigrants | Russia | 91.8 /100 | #123 | Exceptional 79.9% |
| Immigrants | Europe | 91.6 /100 | #124 | Exceptional 79.9% |
| Danes | 91.5 /100 | #125 | Exceptional 79.9% |
| Immigrants | France | 90.7 /100 | #126 | Exceptional 79.9% |
Demographics Similar to Carpatho Rusyns by In Labor Force | Age 20-64
In terms of in labor force | age 20-64, the demographic groups most similar to Carpatho Rusyns are Tongan (80.3%, a difference of 0.0%), Burmese (80.3%, a difference of 0.0%), Serbian (80.3%, a difference of 0.010%), Swedish (80.3%, a difference of 0.010%), and Immigrants from Korea (80.3%, a difference of 0.010%).
| Demographics | Rating | Rank | In Labor Force | Age 20-64 |
| Immigrants | Cabo Verde | 99.0 /100 | #55 | Exceptional 80.3% |
| Immigrants | Northern Africa | 99.0 /100 | #56 | Exceptional 80.3% |
| Afghans | 98.9 /100 | #57 | Exceptional 80.3% |
| Serbians | 98.9 /100 | #58 | Exceptional 80.3% |
| Swedes | 98.9 /100 | #59 | Exceptional 80.3% |
| Tongans | 98.8 /100 | #60 | Exceptional 80.3% |
| Burmese | 98.8 /100 | #61 | Exceptional 80.3% |
| Carpatho Rusyns | 98.8 /100 | #62 | Exceptional 80.3% |
| Immigrants | Korea | 98.8 /100 | #63 | Exceptional 80.3% |
| Immigrants | Albania | 98.7 /100 | #64 | Exceptional 80.3% |
| Lithuanians | 98.7 /100 | #65 | Exceptional 80.2% |
| Macedonians | 98.7 /100 | #66 | Exceptional 80.2% |
| Taiwanese | 98.6 /100 | #67 | Exceptional 80.2% |
| Bhutanese | 98.6 /100 | #68 | Exceptional 80.2% |
| Albanians | 98.6 /100 | #69 | Exceptional 80.2% |