Immigrants from Fiji vs Carpatho Rusyn In Labor Force | Age 20-64
COMPARE
Immigrants from Fiji
Carpatho Rusyn
In Labor Force | Age 20-64
In Labor Force | Age 20-64 Comparison
Immigrants from Fiji
Carpatho Rusyns
78.6%
IN LABOR FORCE | AGE 20-64
0.3/ 100
METRIC RATING
260th/ 347
METRIC RANK
80.3%
IN LABOR FORCE | AGE 20-64
98.8/ 100
METRIC RATING
62nd/ 347
METRIC RANK
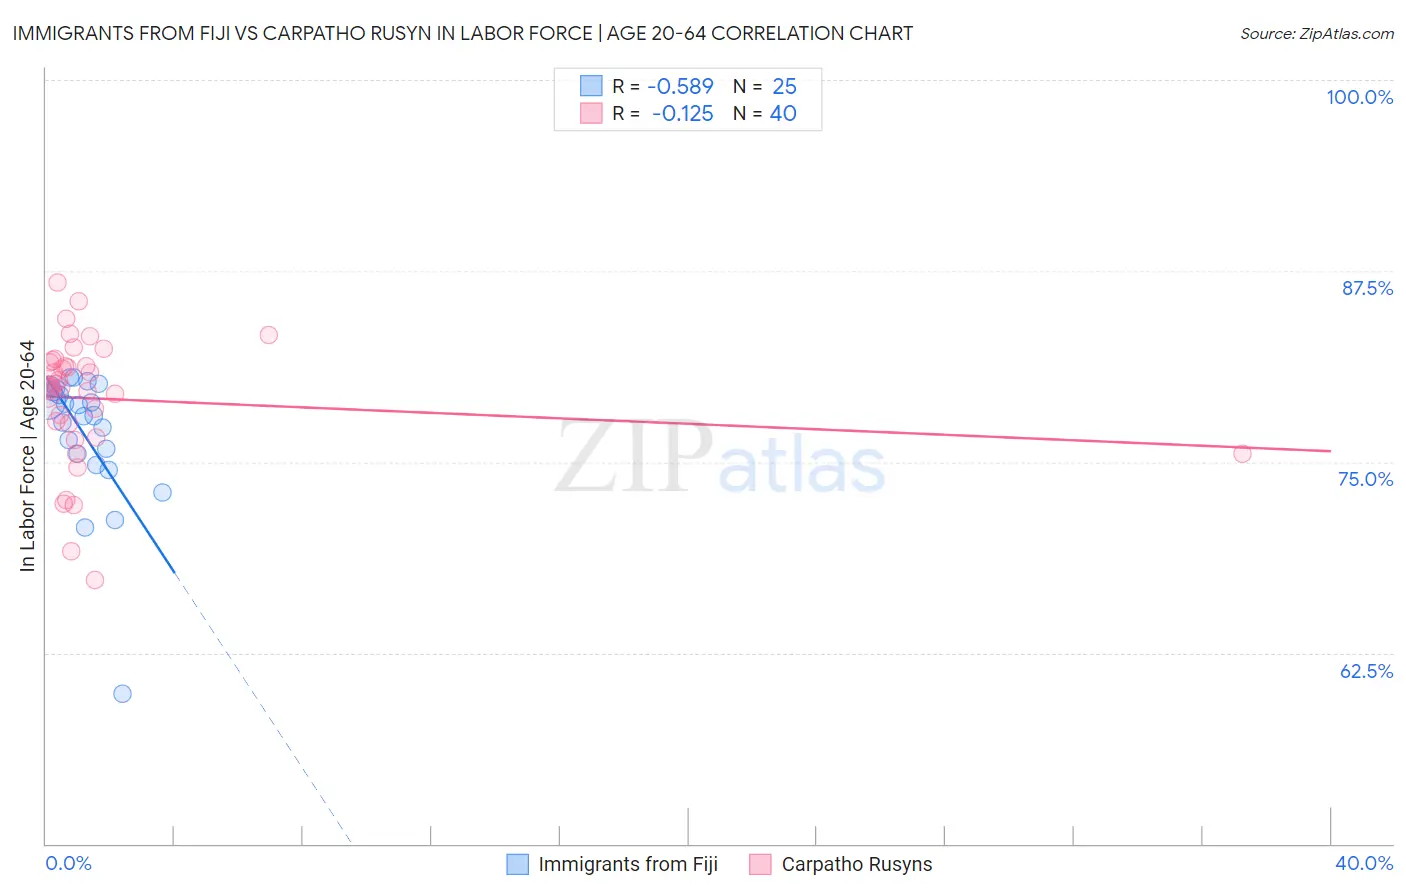
Immigrants from Fiji vs Carpatho Rusyn In Labor Force | Age 20-64 Correlation Chart
The statistical analysis conducted on geographies consisting of 93,756,016 people shows a substantial negative correlation between the proportion of Immigrants from Fiji and labor force participation rate among population between the ages 20 and 64 in the United States with a correlation coefficient (R) of -0.589 and weighted average of 78.6%. Similarly, the statistical analysis conducted on geographies consisting of 58,872,065 people shows a poor negative correlation between the proportion of Carpatho Rusyns and labor force participation rate among population between the ages 20 and 64 in the United States with a correlation coefficient (R) of -0.125 and weighted average of 80.3%, a difference of 2.1%.
In Labor Force | Age 20-64 Correlation Summary
| Measurement | Immigrants from Fiji | Carpatho Rusyn |
| Minimum | 59.8% | 67.3% |
| Maximum | 80.6% | 86.8% |
| Range | 20.8% | 19.5% |
| Mean | 76.7% | 79.1% |
| Median | 78.0% | 80.0% |
| Interquartile 25% (IQ1) | 75.2% | 77.0% |
| Interquartile 75% (IQ3) | 79.7% | 81.6% |
| Interquartile Range (IQR) | 4.5% | 4.5% |
| Standard Deviation (Sample) | 4.5% | 4.2% |
| Standard Deviation (Population) | 4.4% | 4.2% |
Similar Demographics by In Labor Force | Age 20-64
Demographics Similar to Immigrants from Fiji by In Labor Force | Age 20-64
In terms of in labor force | age 20-64, the demographic groups most similar to Immigrants from Fiji are Tsimshian (78.7%, a difference of 0.070%), Guatemalan (78.7%, a difference of 0.11%), Immigrants from Guatemala (78.7%, a difference of 0.11%), White/Caucasian (78.5%, a difference of 0.11%), and Hawaiian (78.7%, a difference of 0.13%).
| Demographics | Rating | Rank | In Labor Force | Age 20-64 |
| Basques | 0.5 /100 | #253 | Tragic 78.7% |
| Immigrants | Lebanon | 0.5 /100 | #254 | Tragic 78.7% |
| Hawaiians | 0.5 /100 | #255 | Tragic 78.7% |
| Celtics | 0.5 /100 | #256 | Tragic 78.7% |
| Guatemalans | 0.4 /100 | #257 | Tragic 78.7% |
| Immigrants | Guatemala | 0.4 /100 | #258 | Tragic 78.7% |
| Tsimshian | 0.4 /100 | #259 | Tragic 78.7% |
| Immigrants | Fiji | 0.3 /100 | #260 | Tragic 78.6% |
| Whites/Caucasians | 0.2 /100 | #261 | Tragic 78.5% |
| Fijians | 0.1 /100 | #262 | Tragic 78.4% |
| Pennsylvania Germans | 0.1 /100 | #263 | Tragic 78.4% |
| Spaniards | 0.1 /100 | #264 | Tragic 78.4% |
| British West Indians | 0.1 /100 | #265 | Tragic 78.4% |
| Bahamians | 0.1 /100 | #266 | Tragic 78.4% |
| U.S. Virgin Islanders | 0.1 /100 | #267 | Tragic 78.4% |
Demographics Similar to Carpatho Rusyns by In Labor Force | Age 20-64
In terms of in labor force | age 20-64, the demographic groups most similar to Carpatho Rusyns are Tongan (80.3%, a difference of 0.0%), Burmese (80.3%, a difference of 0.0%), Serbian (80.3%, a difference of 0.010%), Swedish (80.3%, a difference of 0.010%), and Immigrants from Korea (80.3%, a difference of 0.010%).
| Demographics | Rating | Rank | In Labor Force | Age 20-64 |
| Immigrants | Cabo Verde | 99.0 /100 | #55 | Exceptional 80.3% |
| Immigrants | Northern Africa | 99.0 /100 | #56 | Exceptional 80.3% |
| Afghans | 98.9 /100 | #57 | Exceptional 80.3% |
| Serbians | 98.9 /100 | #58 | Exceptional 80.3% |
| Swedes | 98.9 /100 | #59 | Exceptional 80.3% |
| Tongans | 98.8 /100 | #60 | Exceptional 80.3% |
| Burmese | 98.8 /100 | #61 | Exceptional 80.3% |
| Carpatho Rusyns | 98.8 /100 | #62 | Exceptional 80.3% |
| Immigrants | Korea | 98.8 /100 | #63 | Exceptional 80.3% |
| Immigrants | Albania | 98.7 /100 | #64 | Exceptional 80.3% |
| Lithuanians | 98.7 /100 | #65 | Exceptional 80.2% |
| Macedonians | 98.7 /100 | #66 | Exceptional 80.2% |
| Taiwanese | 98.6 /100 | #67 | Exceptional 80.2% |
| Bhutanese | 98.6 /100 | #68 | Exceptional 80.2% |
| Albanians | 98.6 /100 | #69 | Exceptional 80.2% |