Soviet Union vs Eastern European In Labor Force | Age > 16
COMPARE
Soviet Union
Eastern European
In Labor Force | Age > 16
In Labor Force | Age > 16 Comparison
Soviet Union
Eastern Europeans
65.0%
IN LABOR FORCE | AGE > 16
40.5/ 100
METRIC RATING
183rd/ 347
METRIC RANK
65.1%
IN LABOR FORCE | AGE > 16
46.2/ 100
METRIC RATING
177th/ 347
METRIC RANK
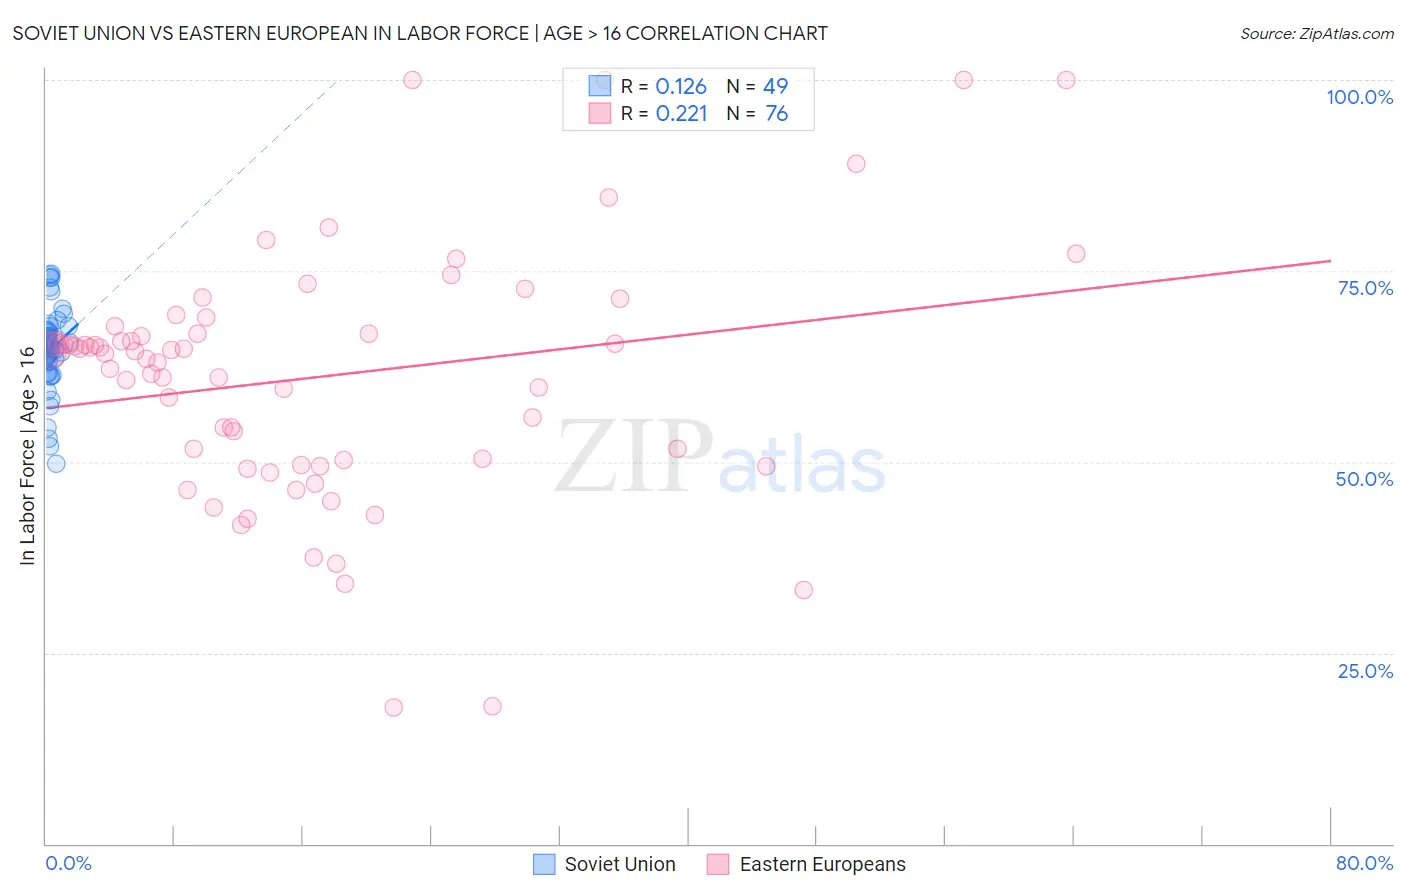
Soviet Union vs Eastern European In Labor Force | Age > 16 Correlation Chart
The statistical analysis conducted on geographies consisting of 43,504,651 people shows a poor positive correlation between the proportion of Soviet Union and labor force participation rate among population ages 16 and over in the United States with a correlation coefficient (R) of 0.126 and weighted average of 65.0%. Similarly, the statistical analysis conducted on geographies consisting of 461,261,446 people shows a weak positive correlation between the proportion of Eastern Europeans and labor force participation rate among population ages 16 and over in the United States with a correlation coefficient (R) of 0.221 and weighted average of 65.1%, a difference of 0.070%.
In Labor Force | Age > 16 Correlation Summary
| Measurement | Soviet Union | Eastern European |
| Minimum | 49.8% | 17.9% |
| Maximum | 74.6% | 100.0% |
| Range | 24.8% | 82.1% |
| Mean | 64.8% | 61.1% |
| Median | 65.1% | 64.3% |
| Interquartile 25% (IQ1) | 62.4% | 49.9% |
| Interquartile 75% (IQ3) | 67.5% | 66.8% |
| Interquartile Range (IQR) | 5.1% | 16.9% |
| Standard Deviation (Sample) | 5.5% | 16.2% |
| Standard Deviation (Population) | 5.4% | 16.1% |
Demographics Similar to Soviet Union and Eastern Europeans by In Labor Force | Age > 16
In terms of in labor force | age > 16, the demographic groups most similar to Soviet Union are Immigrants from Nicaragua (65.1%, a difference of 0.010%), Carpatho Rusyn (65.0%, a difference of 0.010%), Syrian (65.0%, a difference of 0.010%), Immigrants from Panama (65.1%, a difference of 0.020%), and Immigrants from Haiti (65.1%, a difference of 0.030%). Similarly, the demographic groups most similar to Eastern Europeans are Swedish (65.1%, a difference of 0.010%), Trinidadian and Tobagonian (65.1%, a difference of 0.010%), Immigrants from Haiti (65.1%, a difference of 0.030%), Macedonian (65.1%, a difference of 0.040%), and Nicaraguan (65.1%, a difference of 0.040%).
| Demographics | Rating | Rank | In Labor Force | Age > 16 |
| Immigrants | Israel | 61.7 /100 | #170 | Good 65.2% |
| Israelis | 61.6 /100 | #171 | Good 65.2% |
| Immigrants | Sweden | 61.3 /100 | #172 | Good 65.2% |
| Immigrants | Ukraine | 53.7 /100 | #173 | Average 65.1% |
| Macedonians | 50.0 /100 | #174 | Average 65.1% |
| Nicaraguans | 49.7 /100 | #175 | Average 65.1% |
| Swedes | 47.4 /100 | #176 | Average 65.1% |
| Eastern Europeans | 46.2 /100 | #177 | Average 65.1% |
| Trinidadians and Tobagonians | 45.2 /100 | #178 | Average 65.1% |
| Immigrants | Haiti | 43.3 /100 | #179 | Average 65.1% |
| Immigrants | Latvia | 42.9 /100 | #180 | Average 65.1% |
| Immigrants | Panama | 42.4 /100 | #181 | Average 65.1% |
| Immigrants | Nicaragua | 41.1 /100 | #182 | Average 65.1% |
| Soviet Union | 40.5 /100 | #183 | Average 65.0% |
| Carpatho Rusyns | 40.0 /100 | #184 | Average 65.0% |
| Syrians | 40.0 /100 | #185 | Average 65.0% |
| Immigrants | Switzerland | 38.2 /100 | #186 | Fair 65.0% |
| Immigrants | Croatia | 35.7 /100 | #187 | Fair 65.0% |
| Immigrants | Portugal | 34.8 /100 | #188 | Fair 65.0% |
| Immigrants | Greece | 34.3 /100 | #189 | Fair 65.0% |
| Barbadians | 33.9 /100 | #190 | Fair 65.0% |