Soviet Union vs Immigrants from Argentina 10th Grade
COMPARE
Soviet Union
Immigrants from Argentina
10th Grade
10th Grade Comparison
Soviet Union
Immigrants from Argentina
94.6%
10TH GRADE
98.3/ 100
METRIC RATING
93rd/ 347
METRIC RANK
93.7%
10TH GRADE
47.1/ 100
METRIC RATING
176th/ 347
METRIC RANK
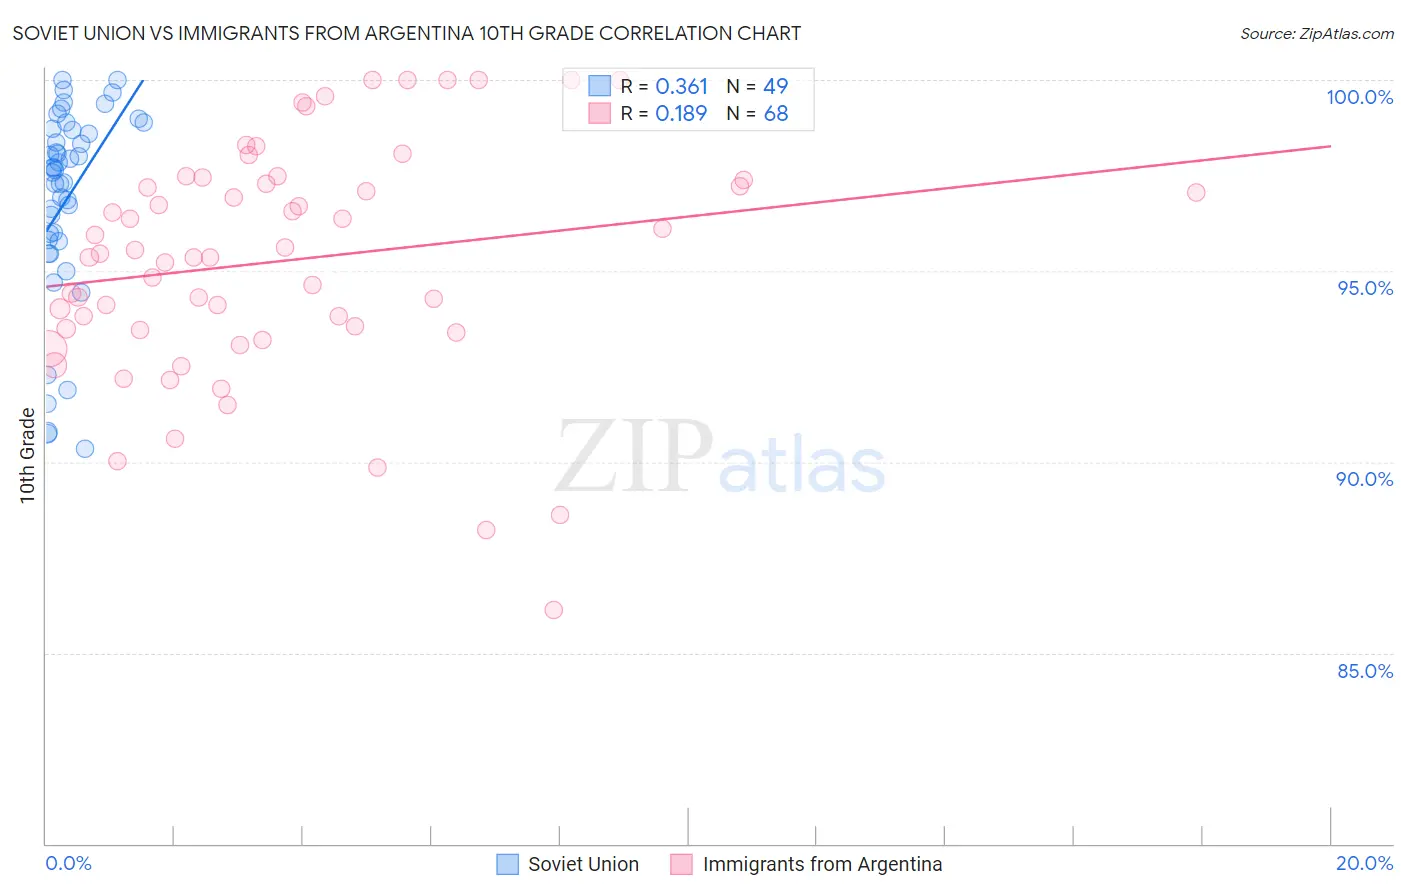
Soviet Union vs Immigrants from Argentina 10th Grade Correlation Chart
The statistical analysis conducted on geographies consisting of 43,454,395 people shows a mild positive correlation between the proportion of Soviet Union and percentage of population with at least 10th grade education in the United States with a correlation coefficient (R) of 0.361 and weighted average of 94.6%. Similarly, the statistical analysis conducted on geographies consisting of 264,436,618 people shows a poor positive correlation between the proportion of Immigrants from Argentina and percentage of population with at least 10th grade education in the United States with a correlation coefficient (R) of 0.189 and weighted average of 93.7%, a difference of 0.94%.
10th Grade Correlation Summary
| Measurement | Soviet Union | Immigrants from Argentina |
| Minimum | 90.4% | 86.1% |
| Maximum | 100.0% | 100.0% |
| Range | 9.6% | 13.9% |
| Mean | 96.9% | 95.3% |
| Median | 97.7% | 95.4% |
| Interquartile 25% (IQ1) | 95.8% | 93.5% |
| Interquartile 75% (IQ3) | 98.7% | 97.3% |
| Interquartile Range (IQR) | 2.9% | 3.9% |
| Standard Deviation (Sample) | 2.5% | 3.1% |
| Standard Deviation (Population) | 2.5% | 3.0% |
Similar Demographics by 10th Grade
Demographics Similar to Soviet Union by 10th Grade
In terms of 10th grade, the demographic groups most similar to Soviet Union are Immigrants from Germany (94.6%, a difference of 0.0%), Yugoslavian (94.6%, a difference of 0.010%), Menominee (94.6%, a difference of 0.010%), Immigrants from Switzerland (94.6%, a difference of 0.010%), and Lebanese (94.6%, a difference of 0.010%).
| Demographics | Rating | Rank | 10th Grade |
| Puget Sound Salish | 99.0 /100 | #86 | Exceptional 94.7% |
| Immigrants | Saudi Arabia | 99.0 /100 | #87 | Exceptional 94.7% |
| Immigrants | Japan | 99.0 /100 | #88 | Exceptional 94.7% |
| Immigrants | Moldova | 98.9 /100 | #89 | Exceptional 94.7% |
| South Africans | 98.8 /100 | #90 | Exceptional 94.7% |
| Whites/Caucasians | 98.8 /100 | #91 | Exceptional 94.7% |
| Yugoslavians | 98.4 /100 | #92 | Exceptional 94.6% |
| Soviet Union | 98.3 /100 | #93 | Exceptional 94.6% |
| Immigrants | Germany | 98.3 /100 | #94 | Exceptional 94.6% |
| Menominee | 98.3 /100 | #95 | Exceptional 94.6% |
| Immigrants | Switzerland | 98.3 /100 | #96 | Exceptional 94.6% |
| Lebanese | 98.3 /100 | #97 | Exceptional 94.6% |
| Immigrants | Bulgaria | 98.1 /100 | #98 | Exceptional 94.6% |
| Immigrants | France | 97.9 /100 | #99 | Exceptional 94.5% |
| Immigrants | South Central Asia | 97.8 /100 | #100 | Exceptional 94.5% |
Demographics Similar to Immigrants from Argentina by 10th Grade
In terms of 10th grade, the demographic groups most similar to Immigrants from Argentina are Immigrants from Lebanon (93.7%, a difference of 0.0%), Sierra Leonean (93.7%, a difference of 0.010%), Immigrants from Nepal (93.7%, a difference of 0.020%), Paraguayan (93.7%, a difference of 0.020%), and French American Indian (93.7%, a difference of 0.030%).
| Demographics | Rating | Rank | 10th Grade |
| Immigrants | Spain | 55.9 /100 | #169 | Average 93.8% |
| Immigrants | Venezuela | 53.9 /100 | #170 | Average 93.8% |
| Immigrants | Albania | 52.4 /100 | #171 | Average 93.8% |
| French American Indians | 50.9 /100 | #172 | Average 93.7% |
| Spaniards | 50.3 /100 | #173 | Average 93.7% |
| Argentineans | 50.0 /100 | #174 | Average 93.7% |
| Immigrants | Nepal | 49.6 /100 | #175 | Average 93.7% |
| Immigrants | Argentina | 47.1 /100 | #176 | Average 93.7% |
| Immigrants | Lebanon | 47.1 /100 | #177 | Average 93.7% |
| Sierra Leoneans | 46.1 /100 | #178 | Average 93.7% |
| Paraguayans | 45.3 /100 | #179 | Average 93.7% |
| Blackfeet | 42.8 /100 | #180 | Average 93.7% |
| Immigrants | Northern Africa | 41.6 /100 | #181 | Average 93.7% |
| Colville | 38.8 /100 | #182 | Fair 93.6% |
| Guamanians/Chamorros | 37.1 /100 | #183 | Fair 93.6% |