Seminole vs Immigrants from Norway In Labor Force | Age 25-29
COMPARE
Seminole
Immigrants from Norway
In Labor Force | Age 25-29
In Labor Force | Age 25-29 Comparison
Seminole
Immigrants from Norway
81.7%
IN LABOR FORCE | AGE 25-29
0.0/ 100
METRIC RATING
319th/ 347
METRIC RANK
84.6%
IN LABOR FORCE | AGE 25-29
41.9/ 100
METRIC RATING
181st/ 347
METRIC RANK
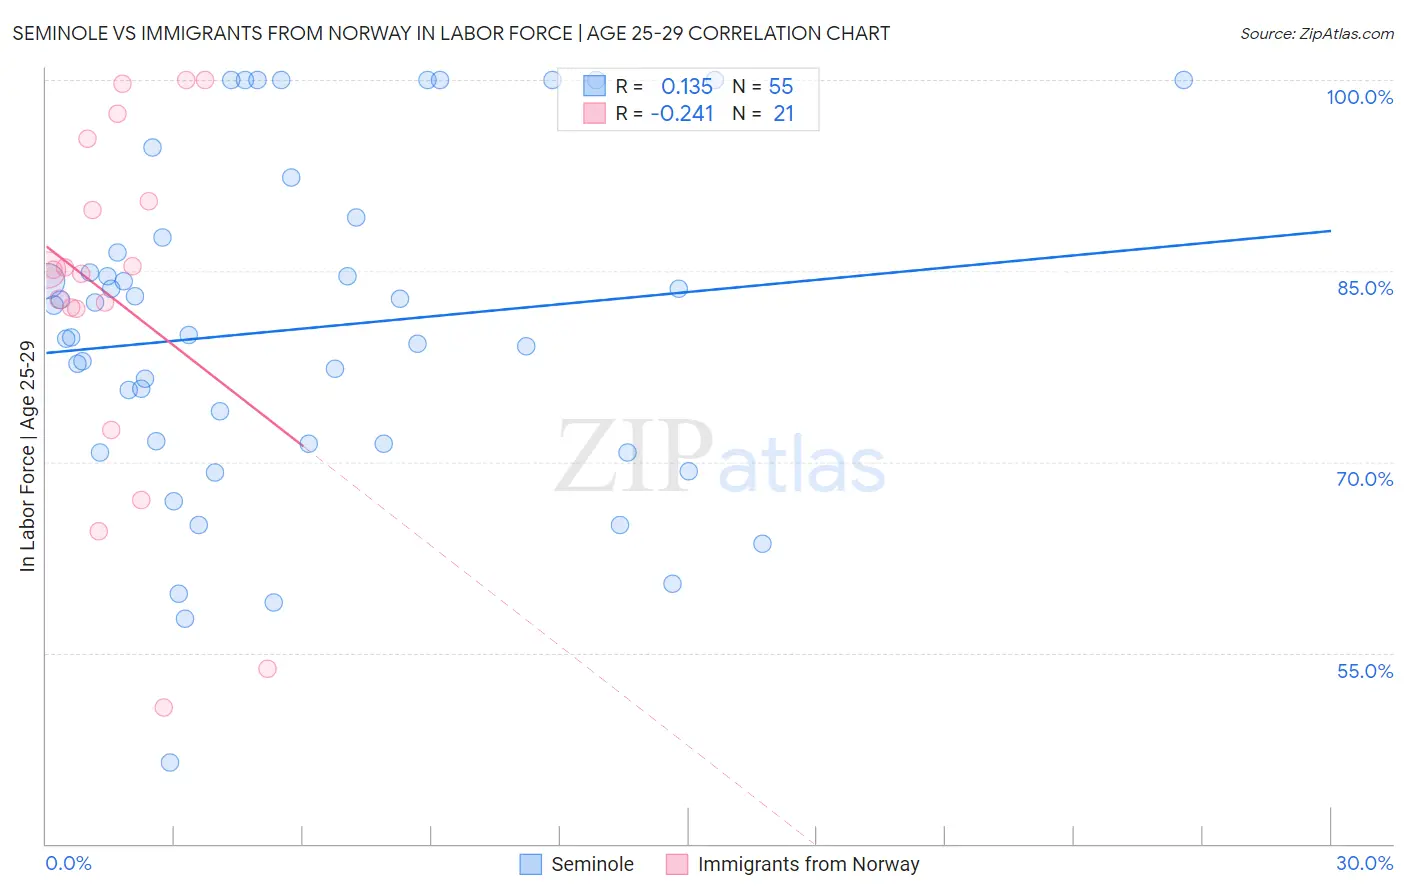
Seminole vs Immigrants from Norway In Labor Force | Age 25-29 Correlation Chart
The statistical analysis conducted on geographies consisting of 118,300,906 people shows a poor positive correlation between the proportion of Seminole and labor force participation rate among population between the ages 25 and 29 in the United States with a correlation coefficient (R) of 0.135 and weighted average of 81.7%. Similarly, the statistical analysis conducted on geographies consisting of 116,700,370 people shows a weak negative correlation between the proportion of Immigrants from Norway and labor force participation rate among population between the ages 25 and 29 in the United States with a correlation coefficient (R) of -0.241 and weighted average of 84.6%, a difference of 3.6%.
In Labor Force | Age 25-29 Correlation Summary
| Measurement | Seminole | Immigrants from Norway |
| Minimum | 46.3% | 50.7% |
| Maximum | 100.0% | 100.0% |
| Range | 53.7% | 49.3% |
| Mean | 80.4% | 82.7% |
| Median | 80.0% | 85.1% |
| Interquartile 25% (IQ1) | 71.4% | 77.2% |
| Interquartile 75% (IQ3) | 87.6% | 92.9% |
| Interquartile Range (IQR) | 16.2% | 15.7% |
| Standard Deviation (Sample) | 13.0% | 14.1% |
| Standard Deviation (Population) | 12.9% | 13.7% |
Similar Demographics by In Labor Force | Age 25-29
Demographics Similar to Seminole by In Labor Force | Age 25-29
In terms of in labor force | age 25-29, the demographic groups most similar to Seminole are Colville (81.6%, a difference of 0.050%), Shoshone (81.6%, a difference of 0.11%), Kiowa (81.6%, a difference of 0.12%), Alaska Native (81.6%, a difference of 0.16%), and Comanche (81.9%, a difference of 0.22%).
| Demographics | Rating | Rank | In Labor Force | Age 25-29 |
| Hispanics or Latinos | 0.0 /100 | #312 | Tragic 82.2% |
| Yaqui | 0.0 /100 | #313 | Tragic 82.2% |
| Cherokee | 0.0 /100 | #314 | Tragic 82.1% |
| Immigrants | Mexico | 0.0 /100 | #315 | Tragic 82.0% |
| Mexicans | 0.0 /100 | #316 | Tragic 81.9% |
| Chickasaw | 0.0 /100 | #317 | Tragic 81.9% |
| Comanche | 0.0 /100 | #318 | Tragic 81.9% |
| Seminole | 0.0 /100 | #319 | Tragic 81.7% |
| Colville | 0.0 /100 | #320 | Tragic 81.6% |
| Shoshone | 0.0 /100 | #321 | Tragic 81.6% |
| Kiowa | 0.0 /100 | #322 | Tragic 81.6% |
| Alaska Natives | 0.0 /100 | #323 | Tragic 81.6% |
| Houma | 0.0 /100 | #324 | Tragic 81.2% |
| Dutch West Indians | 0.0 /100 | #325 | Tragic 81.1% |
| Choctaw | 0.0 /100 | #326 | Tragic 81.0% |
Demographics Similar to Immigrants from Norway by In Labor Force | Age 25-29
In terms of in labor force | age 25-29, the demographic groups most similar to Immigrants from Norway are Immigrants from South America (84.6%, a difference of 0.010%), European (84.6%, a difference of 0.010%), Scottish (84.6%, a difference of 0.010%), Immigrants from Argentina (84.6%, a difference of 0.020%), and Immigrants from China (84.6%, a difference of 0.030%).
| Demographics | Rating | Rank | In Labor Force | Age 25-29 |
| Palestinians | 50.0 /100 | #174 | Average 84.7% |
| Hungarians | 47.8 /100 | #175 | Average 84.6% |
| Malaysians | 46.8 /100 | #176 | Average 84.6% |
| Immigrants | China | 45.7 /100 | #177 | Average 84.6% |
| Immigrants | Thailand | 45.2 /100 | #178 | Average 84.6% |
| Immigrants | Argentina | 44.0 /100 | #179 | Average 84.6% |
| Immigrants | South America | 42.9 /100 | #180 | Average 84.6% |
| Immigrants | Norway | 41.9 /100 | #181 | Average 84.6% |
| Europeans | 40.3 /100 | #182 | Average 84.6% |
| Scottish | 40.1 /100 | #183 | Average 84.6% |
| Immigrants | Kuwait | 38.2 /100 | #184 | Fair 84.6% |
| Immigrants | Denmark | 37.0 /100 | #185 | Fair 84.6% |
| Immigrants | Belgium | 35.0 /100 | #186 | Fair 84.6% |
| Immigrants | Portugal | 34.7 /100 | #187 | Fair 84.6% |
| Immigrants | Ukraine | 33.7 /100 | #188 | Fair 84.5% |