Somali vs Immigrants from Czechoslovakia In Labor Force | Age 45-54
COMPARE
Somali
Immigrants from Czechoslovakia
In Labor Force | Age 45-54
In Labor Force | Age 45-54 Comparison
Somalis
Immigrants from Czechoslovakia
83.5%
IN LABOR FORCE | AGE 45-54
98.7/ 100
METRIC RATING
54th/ 347
METRIC RANK
83.4%
IN LABOR FORCE | AGE 45-54
97.1/ 100
METRIC RATING
73rd/ 347
METRIC RANK
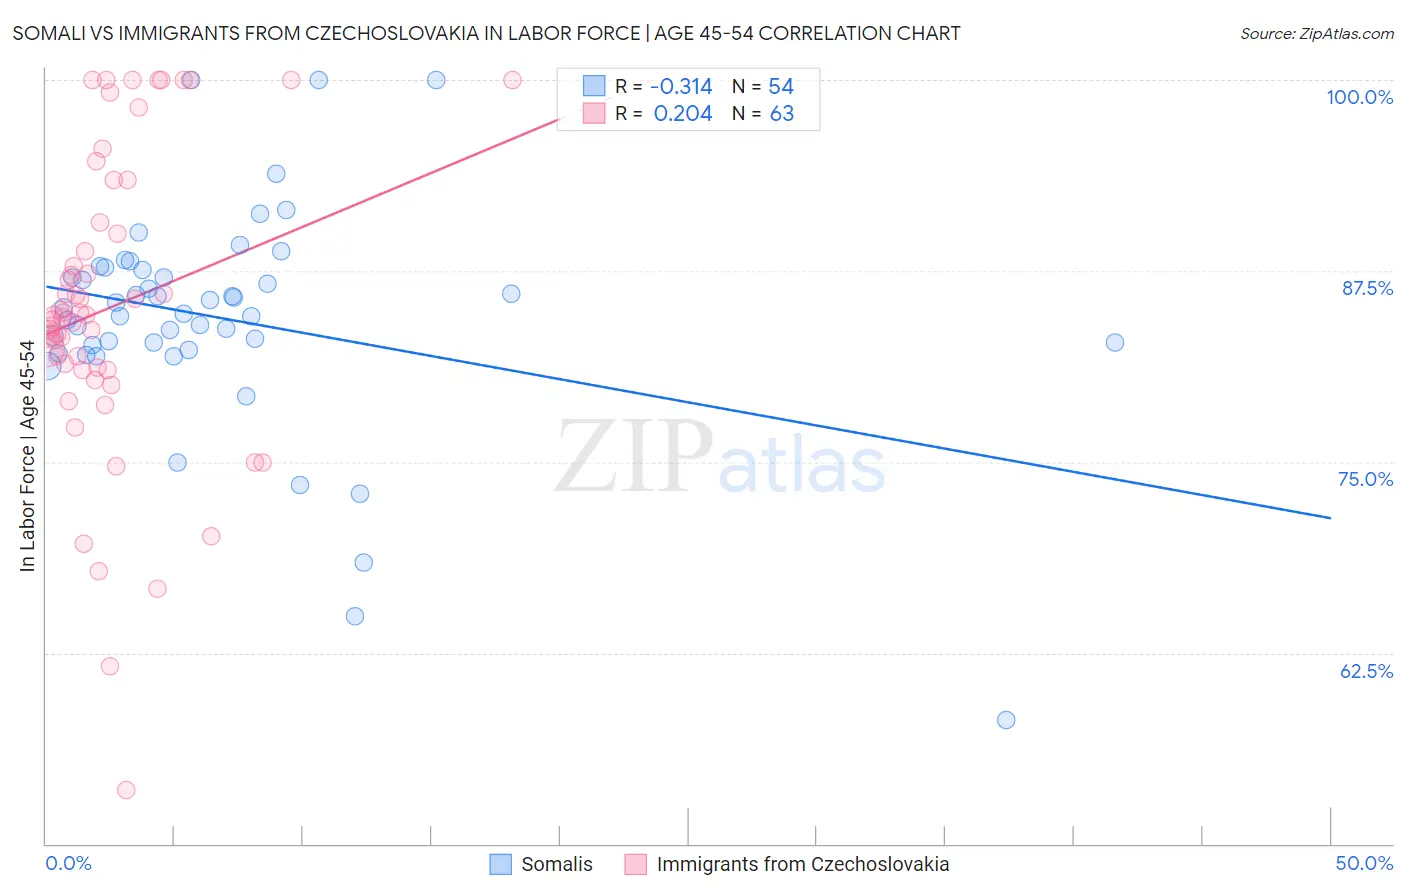
Somali vs Immigrants from Czechoslovakia In Labor Force | Age 45-54 Correlation Chart
The statistical analysis conducted on geographies consisting of 99,291,409 people shows a mild negative correlation between the proportion of Somalis and labor force participation rate among population between the ages 45 and 54 in the United States with a correlation coefficient (R) of -0.314 and weighted average of 83.5%. Similarly, the statistical analysis conducted on geographies consisting of 195,437,318 people shows a weak positive correlation between the proportion of Immigrants from Czechoslovakia and labor force participation rate among population between the ages 45 and 54 in the United States with a correlation coefficient (R) of 0.204 and weighted average of 83.4%, a difference of 0.18%.
In Labor Force | Age 45-54 Correlation Summary
| Measurement | Somali | Immigrants from Czechoslovakia |
| Minimum | 58.1% | 53.5% |
| Maximum | 100.0% | 100.0% |
| Range | 41.9% | 46.5% |
| Mean | 84.4% | 85.1% |
| Median | 84.9% | 84.6% |
| Interquartile 25% (IQ1) | 82.7% | 81.0% |
| Interquartile 75% (IQ3) | 87.6% | 90.7% |
| Interquartile Range (IQR) | 4.9% | 9.6% |
| Standard Deviation (Sample) | 7.3% | 9.9% |
| Standard Deviation (Population) | 7.3% | 9.8% |
Demographics Similar to Somalis and Immigrants from Czechoslovakia by In Labor Force | Age 45-54
In terms of in labor force | age 45-54, the demographic groups most similar to Somalis are Peruvian (83.6%, a difference of 0.010%), Macedonian (83.5%, a difference of 0.010%), Immigrants from Peru (83.5%, a difference of 0.020%), Paraguayan (83.5%, a difference of 0.030%), and Eastern European (83.5%, a difference of 0.040%). Similarly, the demographic groups most similar to Immigrants from Czechoslovakia are Serbian (83.4%, a difference of 0.010%), Immigrants from Latvia (83.4%, a difference of 0.020%), Colombian (83.4%, a difference of 0.020%), Immigrants from Colombia (83.4%, a difference of 0.040%), and Taiwanese (83.4%, a difference of 0.040%).
| Demographics | Rating | Rank | In Labor Force | Age 45-54 |
| Peruvians | 98.7 /100 | #53 | Exceptional 83.6% |
| Somalis | 98.7 /100 | #54 | Exceptional 83.5% |
| Macedonians | 98.7 /100 | #55 | Exceptional 83.5% |
| Immigrants | Peru | 98.6 /100 | #56 | Exceptional 83.5% |
| Paraguayans | 98.5 /100 | #57 | Exceptional 83.5% |
| Eastern Europeans | 98.5 /100 | #58 | Exceptional 83.5% |
| Bhutanese | 98.3 /100 | #59 | Exceptional 83.5% |
| Carpatho Rusyns | 98.3 /100 | #60 | Exceptional 83.5% |
| Filipinos | 98.3 /100 | #61 | Exceptional 83.5% |
| Immigrants | Taiwan | 98.0 /100 | #62 | Exceptional 83.5% |
| Afghans | 97.9 /100 | #63 | Exceptional 83.5% |
| Immigrants | Kenya | 97.9 /100 | #64 | Exceptional 83.5% |
| Egyptians | 97.9 /100 | #65 | Exceptional 83.5% |
| Asians | 97.7 /100 | #66 | Exceptional 83.4% |
| Chileans | 97.7 /100 | #67 | Exceptional 83.4% |
| Immigrants | Colombia | 97.6 /100 | #68 | Exceptional 83.4% |
| Taiwanese | 97.5 /100 | #69 | Exceptional 83.4% |
| Immigrants | Latvia | 97.4 /100 | #70 | Exceptional 83.4% |
| Colombians | 97.3 /100 | #71 | Exceptional 83.4% |
| Serbians | 97.2 /100 | #72 | Exceptional 83.4% |
| Immigrants | Czechoslovakia | 97.1 /100 | #73 | Exceptional 83.4% |