Somali vs Nicaraguan In Labor Force | Age 45-54
COMPARE
Somali
Nicaraguan
In Labor Force | Age 45-54
In Labor Force | Age 45-54 Comparison
Somalis
Nicaraguans
83.5%
IN LABOR FORCE | AGE 45-54
98.7/ 100
METRIC RATING
54th/ 347
METRIC RANK
82.8%
IN LABOR FORCE | AGE 45-54
50.3/ 100
METRIC RATING
173rd/ 347
METRIC RANK
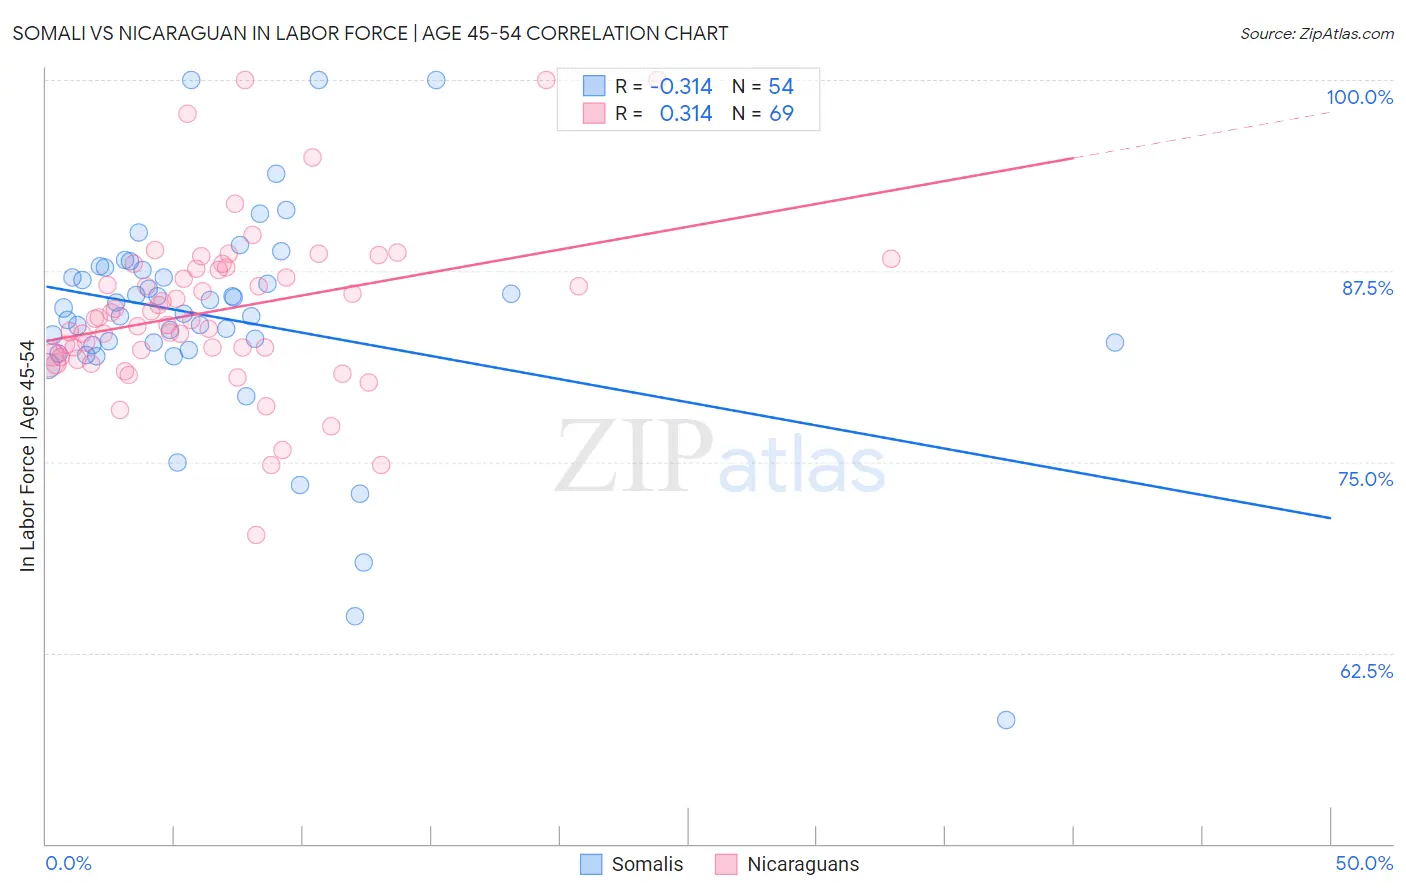
Somali vs Nicaraguan In Labor Force | Age 45-54 Correlation Chart
The statistical analysis conducted on geographies consisting of 99,291,409 people shows a mild negative correlation between the proportion of Somalis and labor force participation rate among population between the ages 45 and 54 in the United States with a correlation coefficient (R) of -0.314 and weighted average of 83.5%. Similarly, the statistical analysis conducted on geographies consisting of 285,614,778 people shows a mild positive correlation between the proportion of Nicaraguans and labor force participation rate among population between the ages 45 and 54 in the United States with a correlation coefficient (R) of 0.314 and weighted average of 82.8%, a difference of 0.95%.
In Labor Force | Age 45-54 Correlation Summary
| Measurement | Somali | Nicaraguan |
| Minimum | 58.1% | 70.2% |
| Maximum | 100.0% | 100.0% |
| Range | 41.9% | 29.8% |
| Mean | 84.4% | 84.9% |
| Median | 84.9% | 84.4% |
| Interquartile 25% (IQ1) | 82.7% | 81.9% |
| Interquartile 75% (IQ3) | 87.6% | 87.7% |
| Interquartile Range (IQR) | 4.9% | 5.8% |
| Standard Deviation (Sample) | 7.3% | 5.5% |
| Standard Deviation (Population) | 7.3% | 5.4% |
Similar Demographics by In Labor Force | Age 45-54
Demographics Similar to Somalis by In Labor Force | Age 45-54
In terms of in labor force | age 45-54, the demographic groups most similar to Somalis are Immigrants from Turkey (83.6%, a difference of 0.010%), Polish (83.6%, a difference of 0.010%), Peruvian (83.6%, a difference of 0.010%), Macedonian (83.5%, a difference of 0.010%), and Immigrants from Greece (83.6%, a difference of 0.020%).
| Demographics | Rating | Rank | In Labor Force | Age 45-54 |
| Croatians | 99.0 /100 | #47 | Exceptional 83.6% |
| Immigrants | Poland | 99.0 /100 | #48 | Exceptional 83.6% |
| Immigrants | Morocco | 99.0 /100 | #49 | Exceptional 83.6% |
| Immigrants | Greece | 98.8 /100 | #50 | Exceptional 83.6% |
| Immigrants | Turkey | 98.8 /100 | #51 | Exceptional 83.6% |
| Poles | 98.7 /100 | #52 | Exceptional 83.6% |
| Peruvians | 98.7 /100 | #53 | Exceptional 83.6% |
| Somalis | 98.7 /100 | #54 | Exceptional 83.5% |
| Macedonians | 98.7 /100 | #55 | Exceptional 83.5% |
| Immigrants | Peru | 98.6 /100 | #56 | Exceptional 83.5% |
| Paraguayans | 98.5 /100 | #57 | Exceptional 83.5% |
| Eastern Europeans | 98.5 /100 | #58 | Exceptional 83.5% |
| Bhutanese | 98.3 /100 | #59 | Exceptional 83.5% |
| Carpatho Rusyns | 98.3 /100 | #60 | Exceptional 83.5% |
| Filipinos | 98.3 /100 | #61 | Exceptional 83.5% |
Demographics Similar to Nicaraguans by In Labor Force | Age 45-54
In terms of in labor force | age 45-54, the demographic groups most similar to Nicaraguans are Costa Rican (82.8%, a difference of 0.0%), Icelander (82.8%, a difference of 0.010%), Immigrants from Zaire (82.8%, a difference of 0.020%), Immigrants from Liberia (82.7%, a difference of 0.020%), and Immigrants from Western Africa (82.8%, a difference of 0.030%).
| Demographics | Rating | Rank | In Labor Force | Age 45-54 |
| Immigrants | South Eastern Asia | 57.4 /100 | #166 | Average 82.8% |
| Swiss | 56.5 /100 | #167 | Average 82.8% |
| Immigrants | South Africa | 55.8 /100 | #168 | Average 82.8% |
| Immigrants | Western Africa | 54.1 /100 | #169 | Average 82.8% |
| Pakistanis | 53.2 /100 | #170 | Average 82.8% |
| Immigrants | Zaire | 52.9 /100 | #171 | Average 82.8% |
| Icelanders | 51.8 /100 | #172 | Average 82.8% |
| Nicaraguans | 50.3 /100 | #173 | Average 82.8% |
| Costa Ricans | 50.0 /100 | #174 | Average 82.8% |
| Immigrants | Liberia | 47.9 /100 | #175 | Average 82.7% |
| Northern Europeans | 46.9 /100 | #176 | Average 82.7% |
| Immigrants | Nicaragua | 44.6 /100 | #177 | Average 82.7% |
| Nigerians | 40.5 /100 | #178 | Average 82.7% |
| Immigrants | Switzerland | 39.4 /100 | #179 | Fair 82.7% |
| Hungarians | 38.0 /100 | #180 | Fair 82.7% |