Slovene vs Alsatian In Labor Force | Age 45-54
COMPARE
Slovene
Alsatian
In Labor Force | Age 45-54
In Labor Force | Age 45-54 Comparison
Slovenes
Alsatians
83.9%
IN LABOR FORCE | AGE 45-54
99.8/ 100
METRIC RATING
24th/ 347
METRIC RANK
81.3%
IN LABOR FORCE | AGE 45-54
0.0/ 100
METRIC RATING
269th/ 347
METRIC RANK
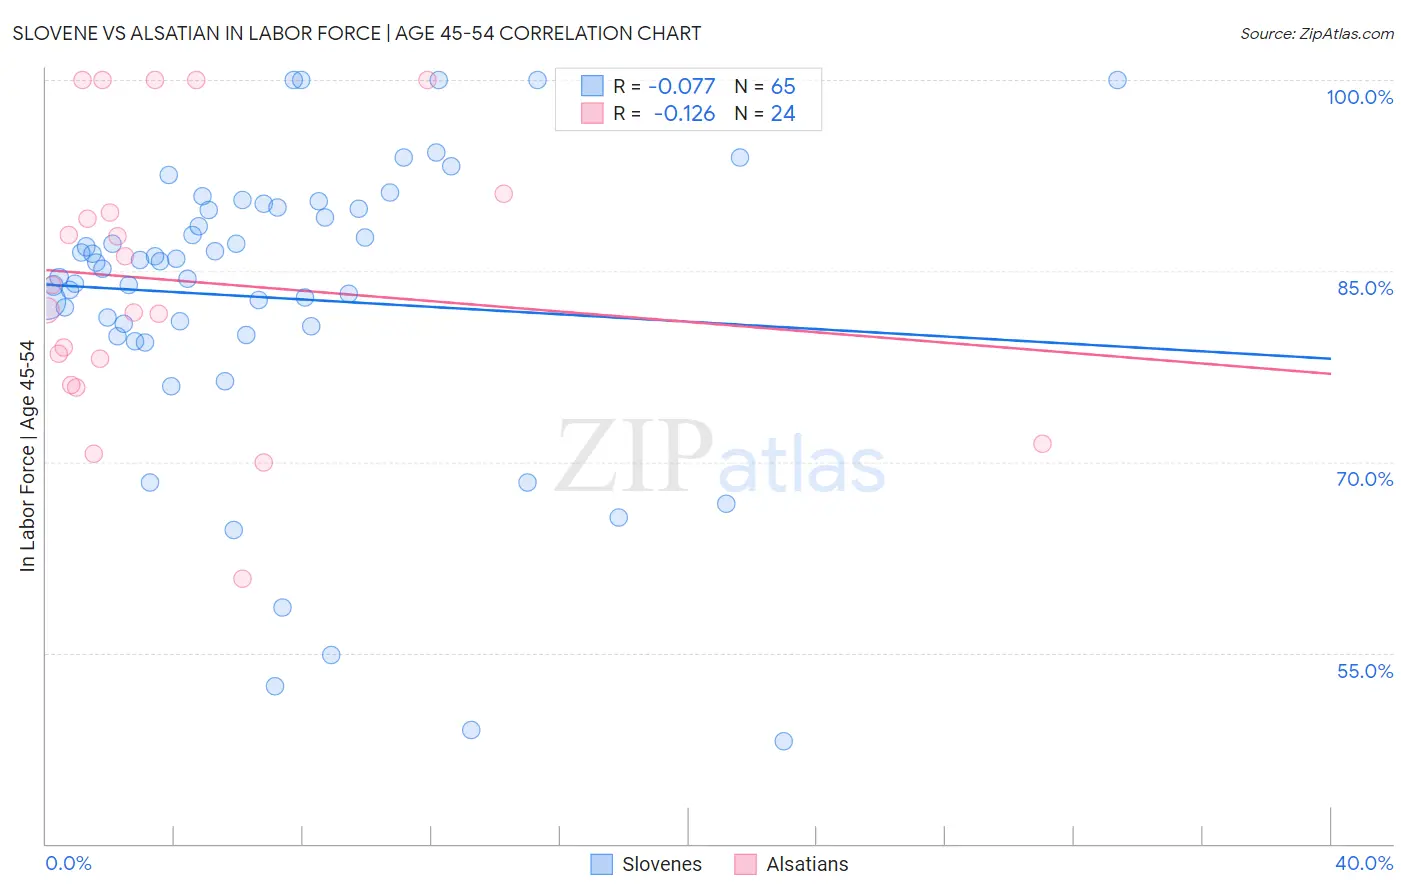
Slovene vs Alsatian In Labor Force | Age 45-54 Correlation Chart
The statistical analysis conducted on geographies consisting of 261,250,739 people shows a slight negative correlation between the proportion of Slovenes and labor force participation rate among population between the ages 45 and 54 in the United States with a correlation coefficient (R) of -0.077 and weighted average of 83.9%. Similarly, the statistical analysis conducted on geographies consisting of 82,679,176 people shows a poor negative correlation between the proportion of Alsatians and labor force participation rate among population between the ages 45 and 54 in the United States with a correlation coefficient (R) of -0.126 and weighted average of 81.3%, a difference of 3.2%.
In Labor Force | Age 45-54 Correlation Summary
| Measurement | Slovene | Alsatian |
| Minimum | 48.1% | 60.8% |
| Maximum | 100.0% | 100.0% |
| Range | 51.9% | 39.2% |
| Mean | 82.9% | 84.2% |
| Median | 85.6% | 82.9% |
| Interquartile 25% (IQ1) | 80.3% | 77.1% |
| Interquartile 75% (IQ3) | 90.0% | 90.3% |
| Interquartile Range (IQR) | 9.6% | 13.2% |
| Standard Deviation (Sample) | 11.8% | 10.9% |
| Standard Deviation (Population) | 11.7% | 10.7% |
Similar Demographics by In Labor Force | Age 45-54
Demographics Similar to Slovenes by In Labor Force | Age 45-54
In terms of in labor force | age 45-54, the demographic groups most similar to Slovenes are Immigrants from Eastern Africa (83.9%, a difference of 0.010%), Immigrants from Sri Lanka (83.9%, a difference of 0.010%), Immigrants from Ireland (83.9%, a difference of 0.010%), Tlingit-Haida (83.9%, a difference of 0.010%), and Czech (83.9%, a difference of 0.030%).
| Demographics | Rating | Rank | In Labor Force | Age 45-54 |
| Zimbabweans | 99.9 /100 | #17 | Exceptional 84.0% |
| Immigrants | South Central Asia | 99.9 /100 | #18 | Exceptional 84.0% |
| Czechs | 99.8 /100 | #19 | Exceptional 83.9% |
| Immigrants | Eastern Africa | 99.8 /100 | #20 | Exceptional 83.9% |
| Immigrants | Sri Lanka | 99.8 /100 | #21 | Exceptional 83.9% |
| Immigrants | Ireland | 99.8 /100 | #22 | Exceptional 83.9% |
| Tlingit-Haida | 99.8 /100 | #23 | Exceptional 83.9% |
| Slovenes | 99.8 /100 | #24 | Exceptional 83.9% |
| Immigrants | North Macedonia | 99.8 /100 | #25 | Exceptional 83.9% |
| Immigrants | Serbia | 99.8 /100 | #26 | Exceptional 83.9% |
| Immigrants | Brazil | 99.8 /100 | #27 | Exceptional 83.9% |
| Immigrants | Lithuania | 99.8 /100 | #28 | Exceptional 83.9% |
| Immigrants | Pakistan | 99.7 /100 | #29 | Exceptional 83.8% |
| Immigrants | Bulgaria | 99.7 /100 | #30 | Exceptional 83.8% |
| Immigrants | Eritrea | 99.7 /100 | #31 | Exceptional 83.8% |
Demographics Similar to Alsatians by In Labor Force | Age 45-54
In terms of in labor force | age 45-54, the demographic groups most similar to Alsatians are Immigrants from Honduras (81.4%, a difference of 0.020%), Bangladeshi (81.3%, a difference of 0.030%), West Indian (81.4%, a difference of 0.040%), Immigrants from Barbados (81.3%, a difference of 0.040%), and Spanish (81.3%, a difference of 0.040%).
| Demographics | Rating | Rank | In Labor Force | Age 45-54 |
| Immigrants | Guyana | 0.1 /100 | #262 | Tragic 81.5% |
| Indonesians | 0.1 /100 | #263 | Tragic 81.5% |
| Immigrants | West Indies | 0.1 /100 | #264 | Tragic 81.5% |
| Hondurans | 0.1 /100 | #265 | Tragic 81.4% |
| Immigrants | St. Vincent and the Grenadines | 0.1 /100 | #266 | Tragic 81.4% |
| West Indians | 0.1 /100 | #267 | Tragic 81.4% |
| Immigrants | Honduras | 0.0 /100 | #268 | Tragic 81.4% |
| Alsatians | 0.0 /100 | #269 | Tragic 81.3% |
| Bangladeshis | 0.0 /100 | #270 | Tragic 81.3% |
| Immigrants | Barbados | 0.0 /100 | #271 | Tragic 81.3% |
| Spanish | 0.0 /100 | #272 | Tragic 81.3% |
| Chippewa | 0.0 /100 | #273 | Tragic 81.3% |
| British West Indians | 0.0 /100 | #274 | Tragic 81.2% |
| Immigrants | Nonimmigrants | 0.0 /100 | #275 | Tragic 81.2% |
| U.S. Virgin Islanders | 0.0 /100 | #276 | Tragic 81.2% |