Immigrants from Somalia vs Alsatian In Labor Force | Age 45-54
COMPARE
Immigrants from Somalia
Alsatian
In Labor Force | Age 45-54
In Labor Force | Age 45-54 Comparison
Immigrants from Somalia
Alsatians
83.4%
IN LABOR FORCE | AGE 45-54
96.9/ 100
METRIC RATING
74th/ 347
METRIC RANK
81.3%
IN LABOR FORCE | AGE 45-54
0.0/ 100
METRIC RATING
269th/ 347
METRIC RANK
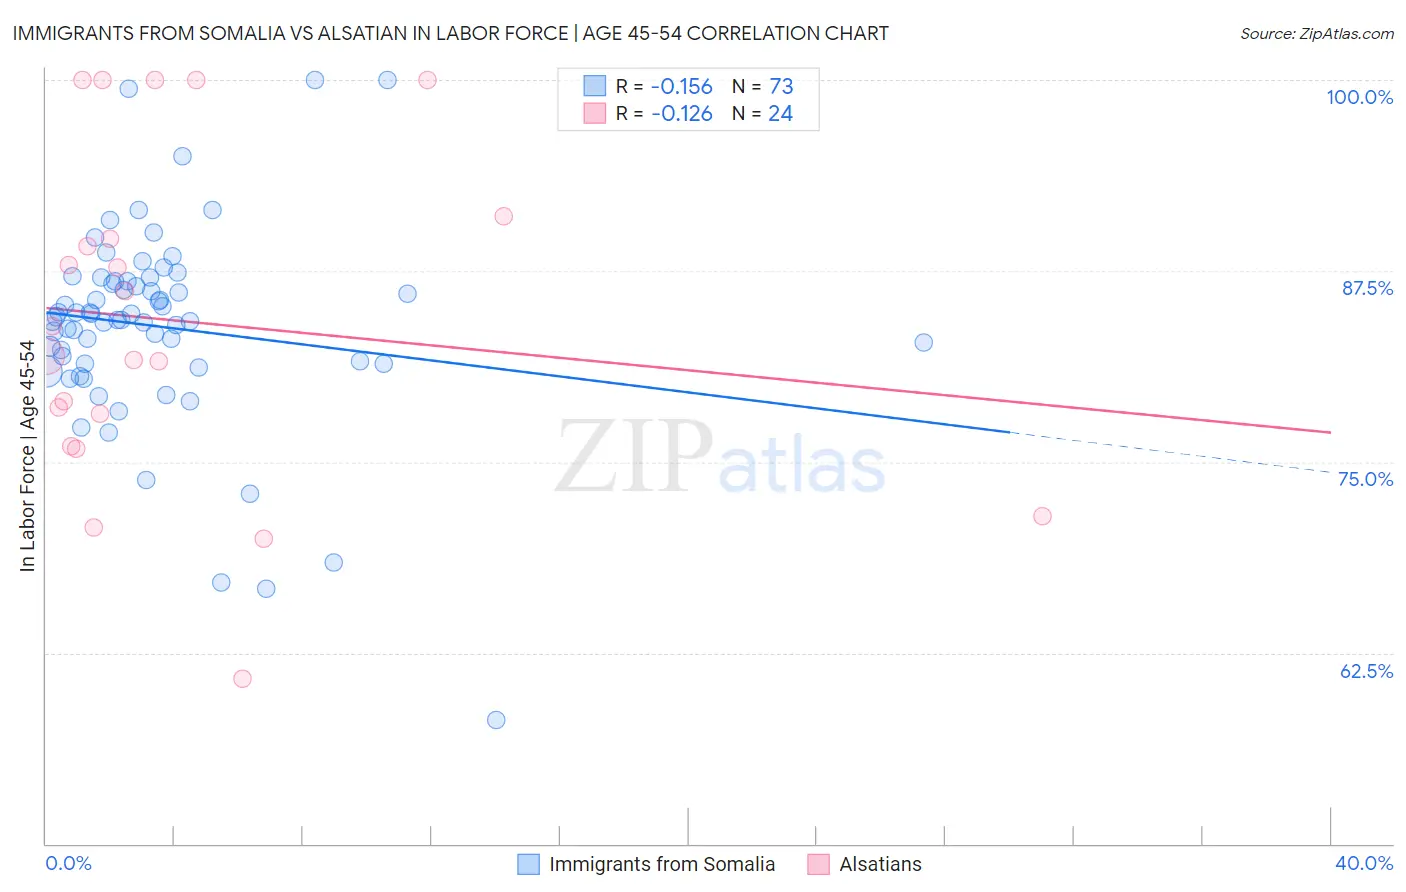
Immigrants from Somalia vs Alsatian In Labor Force | Age 45-54 Correlation Chart
The statistical analysis conducted on geographies consisting of 92,094,629 people shows a poor negative correlation between the proportion of Immigrants from Somalia and labor force participation rate among population between the ages 45 and 54 in the United States with a correlation coefficient (R) of -0.156 and weighted average of 83.4%. Similarly, the statistical analysis conducted on geographies consisting of 82,679,176 people shows a poor negative correlation between the proportion of Alsatians and labor force participation rate among population between the ages 45 and 54 in the United States with a correlation coefficient (R) of -0.126 and weighted average of 81.3%, a difference of 2.5%.
In Labor Force | Age 45-54 Correlation Summary
| Measurement | Immigrants from Somalia | Alsatian |
| Minimum | 58.1% | 60.8% |
| Maximum | 100.0% | 100.0% |
| Range | 41.9% | 39.2% |
| Mean | 83.9% | 84.2% |
| Median | 84.3% | 82.9% |
| Interquartile 25% (IQ1) | 81.4% | 77.1% |
| Interquartile 75% (IQ3) | 86.8% | 90.3% |
| Interquartile Range (IQR) | 5.4% | 13.2% |
| Standard Deviation (Sample) | 6.7% | 10.9% |
| Standard Deviation (Population) | 6.7% | 10.7% |
Similar Demographics by In Labor Force | Age 45-54
Demographics Similar to Immigrants from Somalia by In Labor Force | Age 45-54
In terms of in labor force | age 45-54, the demographic groups most similar to Immigrants from Somalia are Estonian (83.4%, a difference of 0.0%), Russian (83.4%, a difference of 0.0%), Immigrants from Czechoslovakia (83.4%, a difference of 0.010%), Cuban (83.4%, a difference of 0.010%), and Serbian (83.4%, a difference of 0.020%).
| Demographics | Rating | Rank | In Labor Force | Age 45-54 |
| Chileans | 97.7 /100 | #67 | Exceptional 83.4% |
| Immigrants | Colombia | 97.6 /100 | #68 | Exceptional 83.4% |
| Taiwanese | 97.5 /100 | #69 | Exceptional 83.4% |
| Immigrants | Latvia | 97.4 /100 | #70 | Exceptional 83.4% |
| Colombians | 97.3 /100 | #71 | Exceptional 83.4% |
| Serbians | 97.2 /100 | #72 | Exceptional 83.4% |
| Immigrants | Czechoslovakia | 97.1 /100 | #73 | Exceptional 83.4% |
| Immigrants | Somalia | 96.9 /100 | #74 | Exceptional 83.4% |
| Estonians | 96.9 /100 | #75 | Exceptional 83.4% |
| Russians | 96.8 /100 | #76 | Exceptional 83.4% |
| Cubans | 96.7 /100 | #77 | Exceptional 83.4% |
| Immigrants | Egypt | 96.6 /100 | #78 | Exceptional 83.4% |
| Belgians | 96.5 /100 | #79 | Exceptional 83.4% |
| Immigrants | Croatia | 96.5 /100 | #80 | Exceptional 83.4% |
| Jordanians | 96.4 /100 | #81 | Exceptional 83.4% |
Demographics Similar to Alsatians by In Labor Force | Age 45-54
In terms of in labor force | age 45-54, the demographic groups most similar to Alsatians are Immigrants from Honduras (81.4%, a difference of 0.020%), Bangladeshi (81.3%, a difference of 0.030%), West Indian (81.4%, a difference of 0.040%), Immigrants from Barbados (81.3%, a difference of 0.040%), and Spanish (81.3%, a difference of 0.040%).
| Demographics | Rating | Rank | In Labor Force | Age 45-54 |
| Immigrants | Guyana | 0.1 /100 | #262 | Tragic 81.5% |
| Indonesians | 0.1 /100 | #263 | Tragic 81.5% |
| Immigrants | West Indies | 0.1 /100 | #264 | Tragic 81.5% |
| Hondurans | 0.1 /100 | #265 | Tragic 81.4% |
| Immigrants | St. Vincent and the Grenadines | 0.1 /100 | #266 | Tragic 81.4% |
| West Indians | 0.1 /100 | #267 | Tragic 81.4% |
| Immigrants | Honduras | 0.0 /100 | #268 | Tragic 81.4% |
| Alsatians | 0.0 /100 | #269 | Tragic 81.3% |
| Bangladeshis | 0.0 /100 | #270 | Tragic 81.3% |
| Immigrants | Barbados | 0.0 /100 | #271 | Tragic 81.3% |
| Spanish | 0.0 /100 | #272 | Tragic 81.3% |
| Chippewa | 0.0 /100 | #273 | Tragic 81.3% |
| British West Indians | 0.0 /100 | #274 | Tragic 81.2% |
| Immigrants | Nonimmigrants | 0.0 /100 | #275 | Tragic 81.2% |
| U.S. Virgin Islanders | 0.0 /100 | #276 | Tragic 81.2% |