Slovene vs Immigrants from Kazakhstan In Labor Force | Age 45-54
COMPARE
Slovene
Immigrants from Kazakhstan
In Labor Force | Age 45-54
In Labor Force | Age 45-54 Comparison
Slovenes
Immigrants from Kazakhstan
83.9%
IN LABOR FORCE | AGE 45-54
99.8/ 100
METRIC RATING
24th/ 347
METRIC RANK
83.0%
IN LABOR FORCE | AGE 45-54
81.0/ 100
METRIC RATING
136th/ 347
METRIC RANK
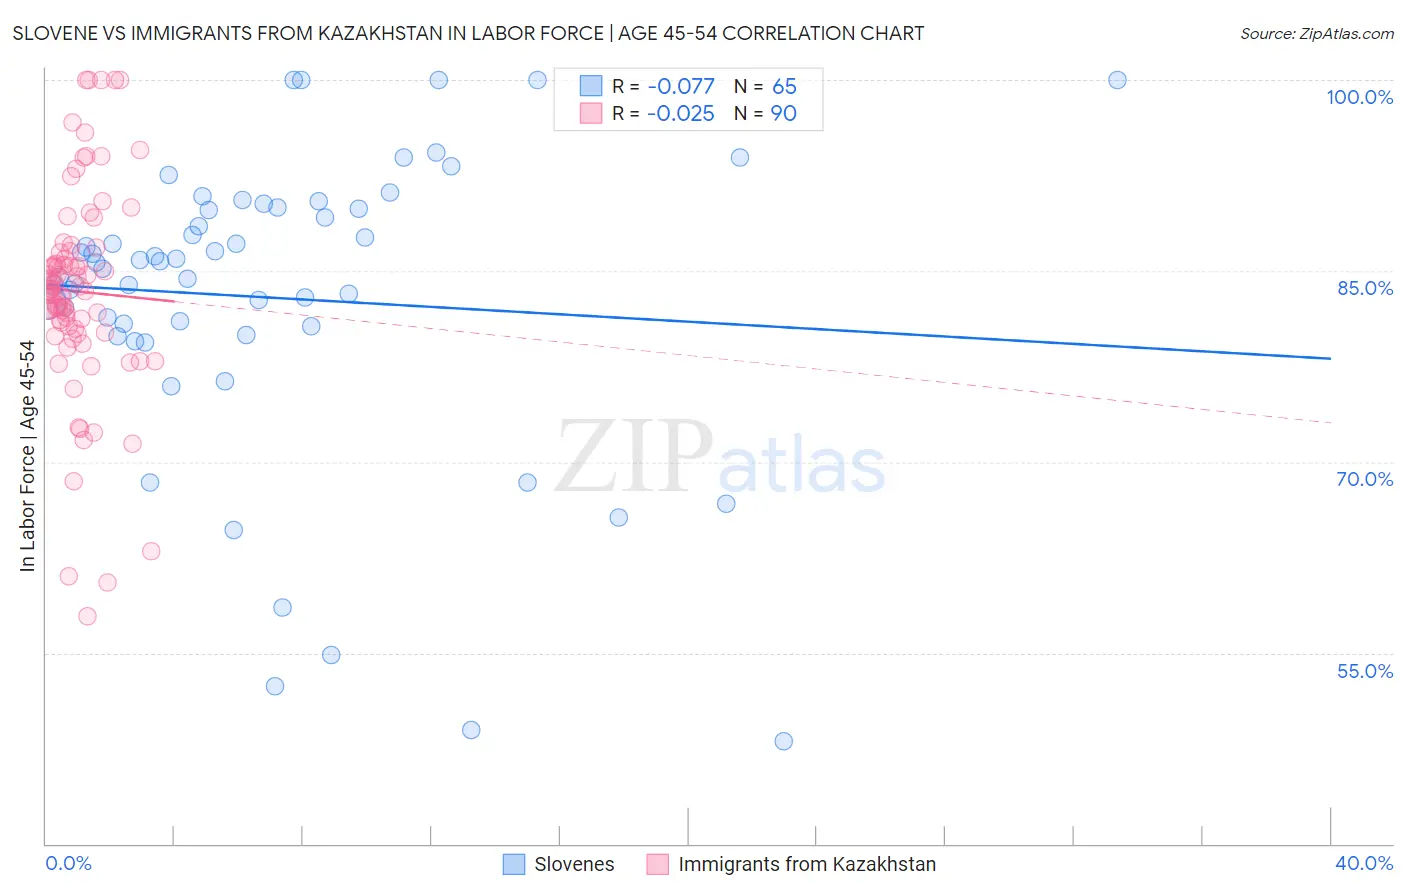
Slovene vs Immigrants from Kazakhstan In Labor Force | Age 45-54 Correlation Chart
The statistical analysis conducted on geographies consisting of 261,250,739 people shows a slight negative correlation between the proportion of Slovenes and labor force participation rate among population between the ages 45 and 54 in the United States with a correlation coefficient (R) of -0.077 and weighted average of 83.9%. Similarly, the statistical analysis conducted on geographies consisting of 124,421,453 people shows no correlation between the proportion of Immigrants from Kazakhstan and labor force participation rate among population between the ages 45 and 54 in the United States with a correlation coefficient (R) of -0.025 and weighted average of 83.0%, a difference of 1.1%.
In Labor Force | Age 45-54 Correlation Summary
| Measurement | Slovene | Immigrants from Kazakhstan |
| Minimum | 48.1% | 57.9% |
| Maximum | 100.0% | 100.0% |
| Range | 51.9% | 42.1% |
| Mean | 82.9% | 83.4% |
| Median | 85.6% | 83.5% |
| Interquartile 25% (IQ1) | 80.3% | 80.4% |
| Interquartile 75% (IQ3) | 90.0% | 86.5% |
| Interquartile Range (IQR) | 9.6% | 6.0% |
| Standard Deviation (Sample) | 11.8% | 8.2% |
| Standard Deviation (Population) | 11.7% | 8.1% |
Similar Demographics by In Labor Force | Age 45-54
Demographics Similar to Slovenes by In Labor Force | Age 45-54
In terms of in labor force | age 45-54, the demographic groups most similar to Slovenes are Immigrants from Eastern Africa (83.9%, a difference of 0.010%), Immigrants from Sri Lanka (83.9%, a difference of 0.010%), Immigrants from Ireland (83.9%, a difference of 0.010%), Tlingit-Haida (83.9%, a difference of 0.010%), and Czech (83.9%, a difference of 0.030%).
| Demographics | Rating | Rank | In Labor Force | Age 45-54 |
| Zimbabweans | 99.9 /100 | #17 | Exceptional 84.0% |
| Immigrants | South Central Asia | 99.9 /100 | #18 | Exceptional 84.0% |
| Czechs | 99.8 /100 | #19 | Exceptional 83.9% |
| Immigrants | Eastern Africa | 99.8 /100 | #20 | Exceptional 83.9% |
| Immigrants | Sri Lanka | 99.8 /100 | #21 | Exceptional 83.9% |
| Immigrants | Ireland | 99.8 /100 | #22 | Exceptional 83.9% |
| Tlingit-Haida | 99.8 /100 | #23 | Exceptional 83.9% |
| Slovenes | 99.8 /100 | #24 | Exceptional 83.9% |
| Immigrants | North Macedonia | 99.8 /100 | #25 | Exceptional 83.9% |
| Immigrants | Serbia | 99.8 /100 | #26 | Exceptional 83.9% |
| Immigrants | Brazil | 99.8 /100 | #27 | Exceptional 83.9% |
| Immigrants | Lithuania | 99.8 /100 | #28 | Exceptional 83.9% |
| Immigrants | Pakistan | 99.7 /100 | #29 | Exceptional 83.8% |
| Immigrants | Bulgaria | 99.7 /100 | #30 | Exceptional 83.8% |
| Immigrants | Eritrea | 99.7 /100 | #31 | Exceptional 83.8% |
Demographics Similar to Immigrants from Kazakhstan by In Labor Force | Age 45-54
In terms of in labor force | age 45-54, the demographic groups most similar to Immigrants from Kazakhstan are Austrian (83.0%, a difference of 0.0%), Sudanese (83.0%, a difference of 0.010%), Immigrants from Spain (83.0%, a difference of 0.010%), Ghanaian (83.0%, a difference of 0.020%), and Finnish (83.1%, a difference of 0.030%).
| Demographics | Rating | Rank | In Labor Force | Age 45-54 |
| Immigrants | Northern Europe | 85.1 /100 | #129 | Excellent 83.1% |
| Immigrants | Israel | 84.7 /100 | #130 | Excellent 83.1% |
| Finns | 83.3 /100 | #131 | Excellent 83.1% |
| Immigrants | Ukraine | 82.9 /100 | #132 | Excellent 83.0% |
| Liberians | 82.7 /100 | #133 | Excellent 83.0% |
| Sudanese | 82.0 /100 | #134 | Excellent 83.0% |
| Austrians | 81.3 /100 | #135 | Excellent 83.0% |
| Immigrants | Kazakhstan | 81.0 /100 | #136 | Excellent 83.0% |
| Immigrants | Spain | 80.4 /100 | #137 | Excellent 83.0% |
| Ghanaians | 79.5 /100 | #138 | Good 83.0% |
| Scandinavians | 78.5 /100 | #139 | Good 83.0% |
| Yugoslavians | 78.3 /100 | #140 | Good 83.0% |
| Immigrants | Haiti | 77.9 /100 | #141 | Good 83.0% |
| Immigrants | Scotland | 77.8 /100 | #142 | Good 83.0% |
| Okinawans | 77.0 /100 | #143 | Good 83.0% |