Slovak vs Luxembourger In Labor Force | Age 45-54
COMPARE
Slovak
Luxembourger
In Labor Force | Age 45-54
In Labor Force | Age 45-54 Comparison
Slovaks
Luxembourgers
83.2%
IN LABOR FORCE | AGE 45-54
92.8/ 100
METRIC RATING
108th/ 347
METRIC RANK
85.0%
IN LABOR FORCE | AGE 45-54
100.0/ 100
METRIC RATING
2nd/ 347
METRIC RANK
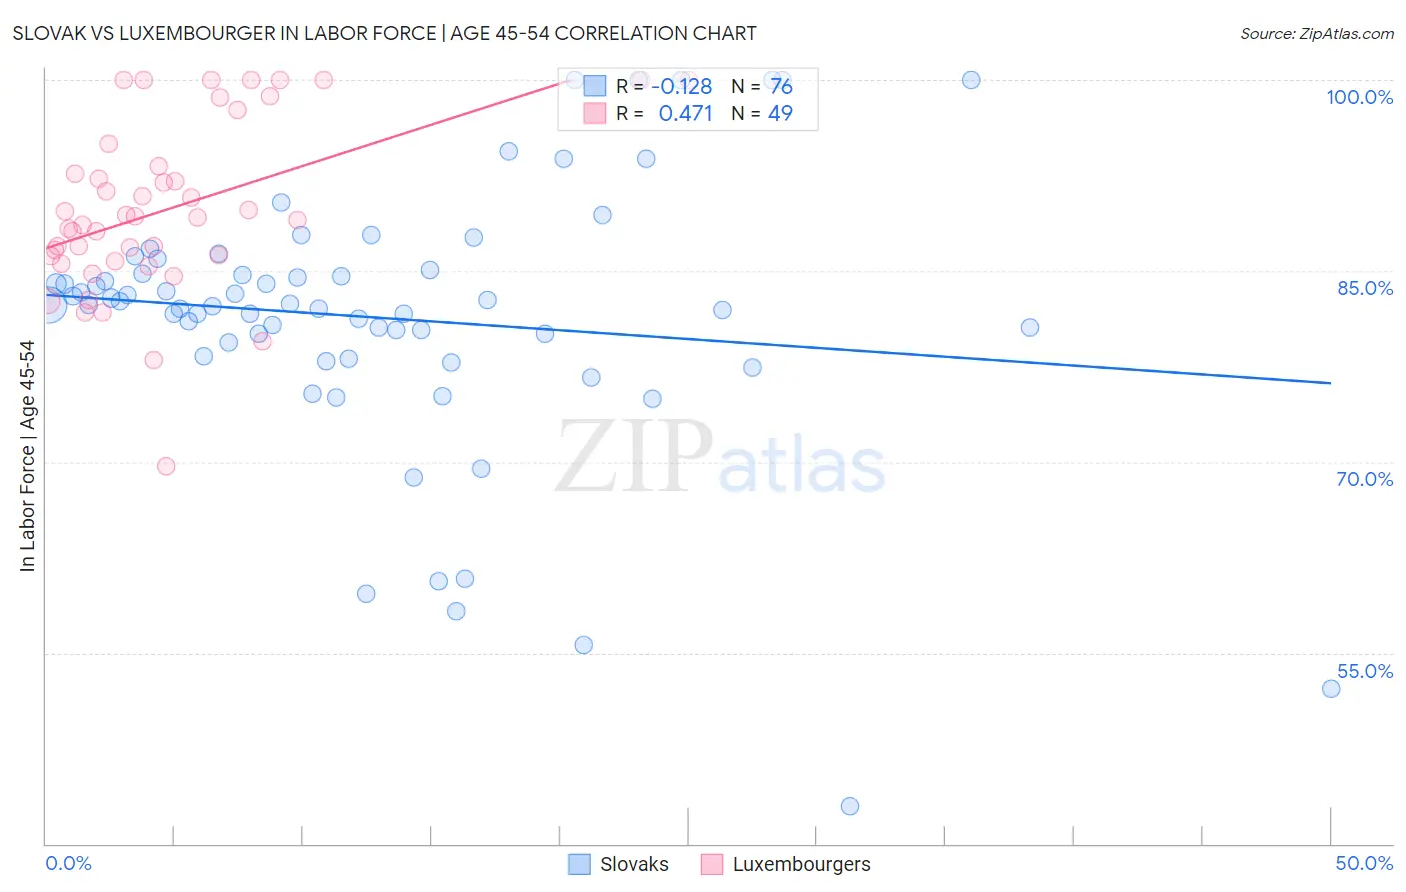
Slovak vs Luxembourger In Labor Force | Age 45-54 Correlation Chart
The statistical analysis conducted on geographies consisting of 397,668,603 people shows a poor negative correlation between the proportion of Slovaks and labor force participation rate among population between the ages 45 and 54 in the United States with a correlation coefficient (R) of -0.128 and weighted average of 83.2%. Similarly, the statistical analysis conducted on geographies consisting of 144,640,644 people shows a moderate positive correlation between the proportion of Luxembourgers and labor force participation rate among population between the ages 45 and 54 in the United States with a correlation coefficient (R) of 0.471 and weighted average of 85.0%, a difference of 2.1%.
In Labor Force | Age 45-54 Correlation Summary
| Measurement | Slovak | Luxembourger |
| Minimum | 42.9% | 69.6% |
| Maximum | 100.0% | 100.0% |
| Range | 57.1% | 30.4% |
| Mean | 81.3% | 89.9% |
| Median | 82.4% | 89.2% |
| Interquartile 25% (IQ1) | 78.8% | 85.9% |
| Interquartile 75% (IQ3) | 84.9% | 94.1% |
| Interquartile Range (IQR) | 6.1% | 8.2% |
| Standard Deviation (Sample) | 10.6% | 6.8% |
| Standard Deviation (Population) | 10.5% | 6.7% |
Similar Demographics by In Labor Force | Age 45-54
Demographics Similar to Slovaks by In Labor Force | Age 45-54
In terms of in labor force | age 45-54, the demographic groups most similar to Slovaks are Iranian (83.2%, a difference of 0.0%), Ukrainian (83.2%, a difference of 0.0%), Immigrants from Africa (83.2%, a difference of 0.0%), Sri Lankan (83.2%, a difference of 0.010%), and Immigrants from Italy (83.2%, a difference of 0.010%).
| Demographics | Rating | Rank | In Labor Force | Age 45-54 |
| Immigrants | Belarus | 94.1 /100 | #101 | Exceptional 83.3% |
| Immigrants | Singapore | 93.9 /100 | #102 | Exceptional 83.3% |
| Albanians | 93.9 /100 | #103 | Exceptional 83.3% |
| Immigrants | Romania | 93.8 /100 | #104 | Exceptional 83.3% |
| Immigrants | South America | 93.5 /100 | #105 | Exceptional 83.2% |
| Sri Lankans | 93.2 /100 | #106 | Exceptional 83.2% |
| Iranians | 92.9 /100 | #107 | Exceptional 83.2% |
| Slovaks | 92.8 /100 | #108 | Exceptional 83.2% |
| Ukrainians | 92.7 /100 | #109 | Exceptional 83.2% |
| Immigrants | Africa | 92.6 /100 | #110 | Exceptional 83.2% |
| Immigrants | Italy | 92.5 /100 | #111 | Exceptional 83.2% |
| Immigrants | Afghanistan | 92.4 /100 | #112 | Exceptional 83.2% |
| Immigrants | Albania | 91.8 /100 | #113 | Exceptional 83.2% |
| Assyrians/Chaldeans/Syriacs | 91.7 /100 | #114 | Exceptional 83.2% |
| Immigrants | Chile | 91.6 /100 | #115 | Exceptional 83.2% |
Demographics Similar to Luxembourgers by In Labor Force | Age 45-54
In terms of in labor force | age 45-54, the demographic groups most similar to Luxembourgers are Bolivian (84.9%, a difference of 0.090%), Immigrants from Ethiopia (84.8%, a difference of 0.21%), Ethiopian (84.8%, a difference of 0.29%), Immigrants from Bolivia (85.3%, a difference of 0.34%), and Immigrants from India (84.7%, a difference of 0.40%).
| Demographics | Rating | Rank | In Labor Force | Age 45-54 |
| Immigrants | Bolivia | 100.0 /100 | #1 | Exceptional 85.3% |
| Luxembourgers | 100.0 /100 | #2 | Exceptional 85.0% |
| Bolivians | 100.0 /100 | #3 | Exceptional 84.9% |
| Immigrants | Ethiopia | 100.0 /100 | #4 | Exceptional 84.8% |
| Ethiopians | 100.0 /100 | #5 | Exceptional 84.8% |
| Immigrants | India | 100.0 /100 | #6 | Exceptional 84.7% |
| Immigrants | Cameroon | 100.0 /100 | #7 | Exceptional 84.6% |
| Sierra Leoneans | 100.0 /100 | #8 | Exceptional 84.5% |
| Immigrants | Sierra Leone | 100.0 /100 | #9 | Exceptional 84.4% |
| Norwegians | 100.0 /100 | #10 | Exceptional 84.4% |
| Thais | 100.0 /100 | #11 | Exceptional 84.3% |
| Bulgarians | 100.0 /100 | #12 | Exceptional 84.2% |
| Chinese | 99.9 /100 | #13 | Exceptional 84.1% |
| Cambodians | 99.9 /100 | #14 | Exceptional 84.1% |
| Cypriots | 99.9 /100 | #15 | Exceptional 84.1% |