Slovak vs Crow In Labor Force | Age 45-54
COMPARE
Slovak
Crow
In Labor Force | Age 45-54
In Labor Force | Age 45-54 Comparison
Slovaks
Crow
83.2%
IN LABOR FORCE | AGE 45-54
92.8/ 100
METRIC RATING
108th/ 347
METRIC RANK
78.3%
IN LABOR FORCE | AGE 45-54
0.0/ 100
METRIC RATING
322nd/ 347
METRIC RANK
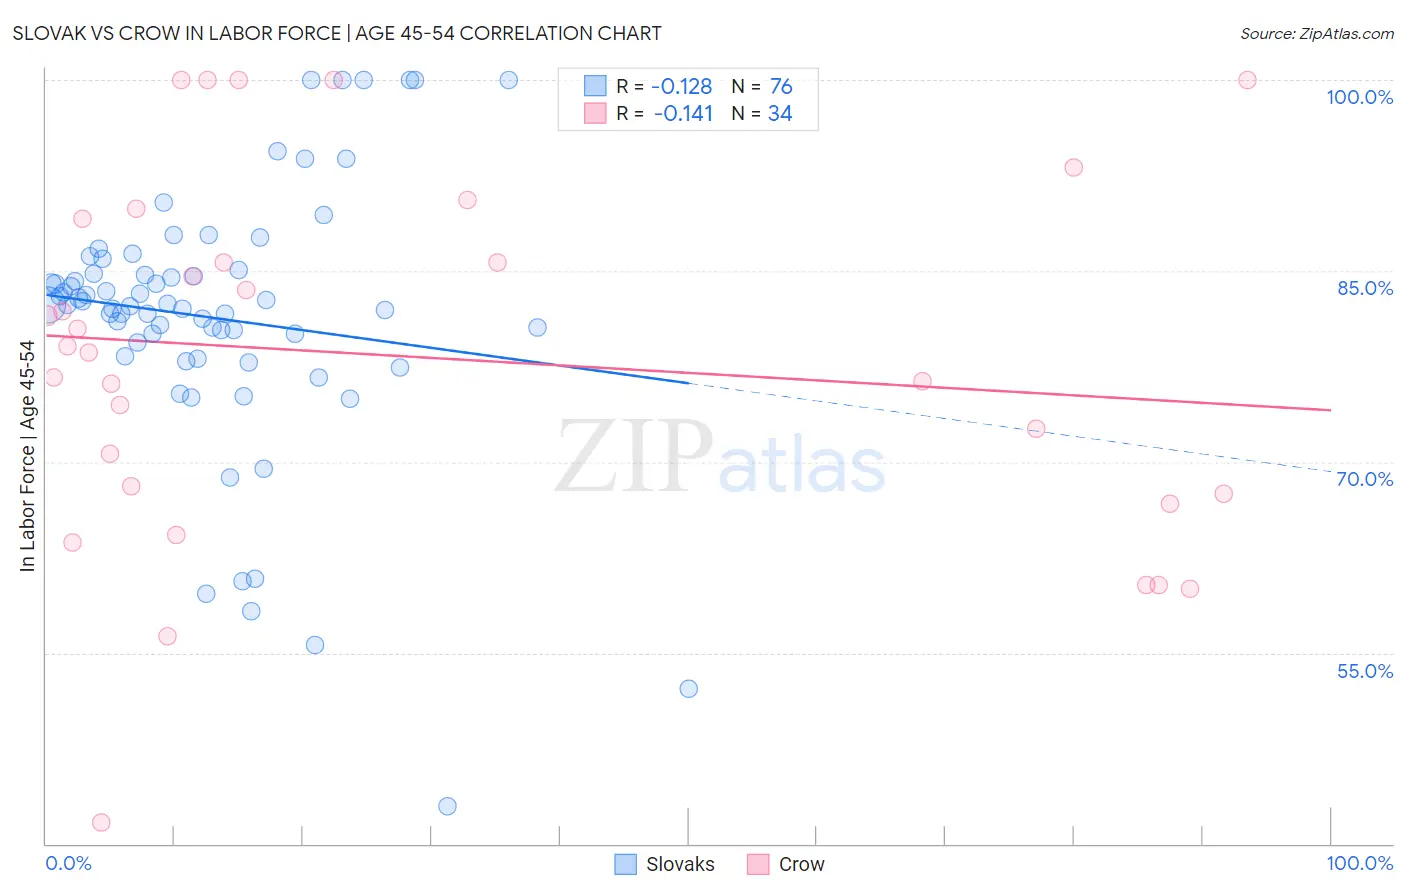
Slovak vs Crow In Labor Force | Age 45-54 Correlation Chart
The statistical analysis conducted on geographies consisting of 397,668,603 people shows a poor negative correlation between the proportion of Slovaks and labor force participation rate among population between the ages 45 and 54 in the United States with a correlation coefficient (R) of -0.128 and weighted average of 83.2%. Similarly, the statistical analysis conducted on geographies consisting of 59,202,110 people shows a poor negative correlation between the proportion of Crow and labor force participation rate among population between the ages 45 and 54 in the United States with a correlation coefficient (R) of -0.141 and weighted average of 78.3%, a difference of 6.3%.
In Labor Force | Age 45-54 Correlation Summary
| Measurement | Slovak | Crow |
| Minimum | 42.9% | 41.7% |
| Maximum | 100.0% | 100.0% |
| Range | 57.1% | 58.3% |
| Mean | 81.3% | 78.2% |
| Median | 82.4% | 78.8% |
| Interquartile 25% (IQ1) | 78.8% | 67.5% |
| Interquartile 75% (IQ3) | 84.9% | 89.1% |
| Interquartile Range (IQR) | 6.1% | 21.6% |
| Standard Deviation (Sample) | 10.6% | 14.4% |
| Standard Deviation (Population) | 10.5% | 14.2% |
Similar Demographics by In Labor Force | Age 45-54
Demographics Similar to Slovaks by In Labor Force | Age 45-54
In terms of in labor force | age 45-54, the demographic groups most similar to Slovaks are Iranian (83.2%, a difference of 0.0%), Ukrainian (83.2%, a difference of 0.0%), Immigrants from Africa (83.2%, a difference of 0.0%), Sri Lankan (83.2%, a difference of 0.010%), and Immigrants from Italy (83.2%, a difference of 0.010%).
| Demographics | Rating | Rank | In Labor Force | Age 45-54 |
| Immigrants | Belarus | 94.1 /100 | #101 | Exceptional 83.3% |
| Immigrants | Singapore | 93.9 /100 | #102 | Exceptional 83.3% |
| Albanians | 93.9 /100 | #103 | Exceptional 83.3% |
| Immigrants | Romania | 93.8 /100 | #104 | Exceptional 83.3% |
| Immigrants | South America | 93.5 /100 | #105 | Exceptional 83.2% |
| Sri Lankans | 93.2 /100 | #106 | Exceptional 83.2% |
| Iranians | 92.9 /100 | #107 | Exceptional 83.2% |
| Slovaks | 92.8 /100 | #108 | Exceptional 83.2% |
| Ukrainians | 92.7 /100 | #109 | Exceptional 83.2% |
| Immigrants | Africa | 92.6 /100 | #110 | Exceptional 83.2% |
| Immigrants | Italy | 92.5 /100 | #111 | Exceptional 83.2% |
| Immigrants | Afghanistan | 92.4 /100 | #112 | Exceptional 83.2% |
| Immigrants | Albania | 91.8 /100 | #113 | Exceptional 83.2% |
| Assyrians/Chaldeans/Syriacs | 91.7 /100 | #114 | Exceptional 83.2% |
| Immigrants | Chile | 91.6 /100 | #115 | Exceptional 83.2% |
Demographics Similar to Crow by In Labor Force | Age 45-54
In terms of in labor force | age 45-54, the demographic groups most similar to Crow are Kiowa (78.3%, a difference of 0.080%), Dutch West Indian (78.2%, a difference of 0.10%), Choctaw (78.2%, a difference of 0.20%), Seminole (78.1%, a difference of 0.24%), and Cajun (78.1%, a difference of 0.25%).
| Demographics | Rating | Rank | In Labor Force | Age 45-54 |
| Blacks/African Americans | 0.0 /100 | #315 | Tragic 79.3% |
| Shoshone | 0.0 /100 | #316 | Tragic 79.3% |
| Comanche | 0.0 /100 | #317 | Tragic 79.2% |
| Chickasaw | 0.0 /100 | #318 | Tragic 79.0% |
| Cherokee | 0.0 /100 | #319 | Tragic 79.0% |
| Yaqui | 0.0 /100 | #320 | Tragic 78.9% |
| Yup'ik | 0.0 /100 | #321 | Tragic 78.6% |
| Crow | 0.0 /100 | #322 | Tragic 78.3% |
| Kiowa | 0.0 /100 | #323 | Tragic 78.3% |
| Dutch West Indians | 0.0 /100 | #324 | Tragic 78.2% |
| Choctaw | 0.0 /100 | #325 | Tragic 78.2% |
| Seminole | 0.0 /100 | #326 | Tragic 78.1% |
| Cajuns | 0.0 /100 | #327 | Tragic 78.1% |
| Sioux | 0.0 /100 | #328 | Tragic 78.0% |
| Creek | 0.0 /100 | #329 | Tragic 77.7% |