Slavic vs Immigrants from Southern Europe In Labor Force | Age 20-64
COMPARE
Slavic
Immigrants from Southern Europe
In Labor Force | Age 20-64
In Labor Force | Age 20-64 Comparison
Slavs
Immigrants from Southern Europe
79.6%
IN LABOR FORCE | AGE 20-64
54.0/ 100
METRIC RATING
170th/ 347
METRIC RANK
79.8%
IN LABOR FORCE | AGE 20-64
78.9/ 100
METRIC RATING
146th/ 347
METRIC RANK
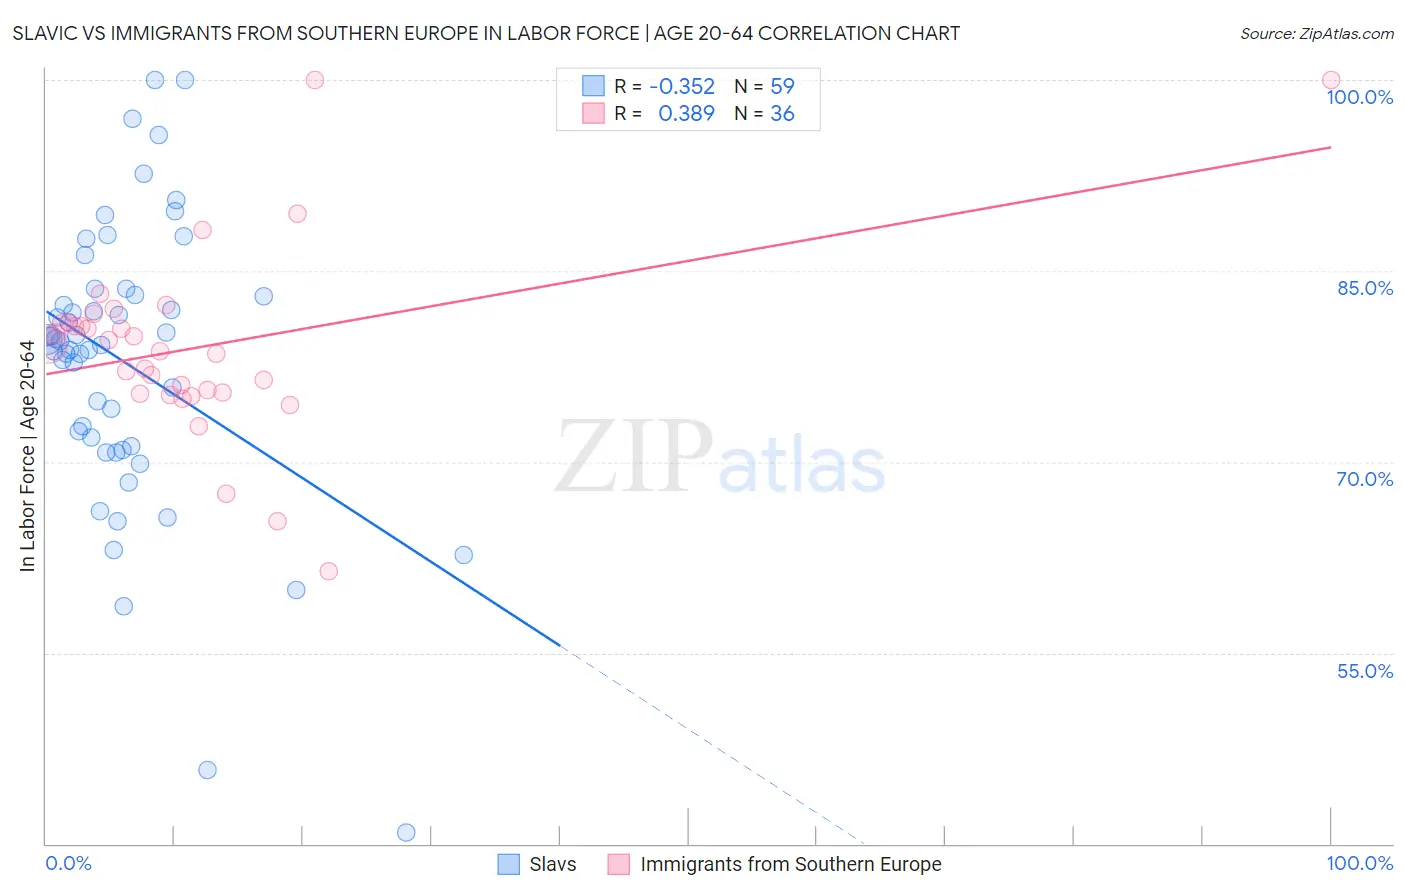
Slavic vs Immigrants from Southern Europe In Labor Force | Age 20-64 Correlation Chart
The statistical analysis conducted on geographies consisting of 270,879,770 people shows a mild negative correlation between the proportion of Slavs and labor force participation rate among population between the ages 20 and 64 in the United States with a correlation coefficient (R) of -0.352 and weighted average of 79.6%. Similarly, the statistical analysis conducted on geographies consisting of 402,797,252 people shows a mild positive correlation between the proportion of Immigrants from Southern Europe and labor force participation rate among population between the ages 20 and 64 in the United States with a correlation coefficient (R) of 0.389 and weighted average of 79.8%, a difference of 0.23%.
In Labor Force | Age 20-64 Correlation Summary
| Measurement | Slavic | Immigrants from Southern Europe |
| Minimum | 40.9% | 61.4% |
| Maximum | 100.0% | 100.0% |
| Range | 59.1% | 38.6% |
| Mean | 77.8% | 79.0% |
| Median | 79.5% | 79.0% |
| Interquartile 25% (IQ1) | 71.2% | 75.4% |
| Interquartile 75% (IQ3) | 83.1% | 80.9% |
| Interquartile Range (IQR) | 11.9% | 5.5% |
| Standard Deviation (Sample) | 11.3% | 7.4% |
| Standard Deviation (Population) | 11.2% | 7.3% |
Similar Demographics by In Labor Force | Age 20-64
Demographics Similar to Slavs by In Labor Force | Age 20-64
In terms of in labor force | age 20-64, the demographic groups most similar to Slavs are Immigrants from Switzerland (79.6%, a difference of 0.010%), Immigrants from Belgium (79.6%, a difference of 0.010%), Immigrants from Scotland (79.6%, a difference of 0.010%), Syrian (79.6%, a difference of 0.030%), and Laotian (79.6%, a difference of 0.040%).
| Demographics | Rating | Rank | In Labor Force | Age 20-64 |
| Immigrants | Costa Rica | 64.6 /100 | #163 | Good 79.7% |
| Immigrants | Burma/Myanmar | 64.4 /100 | #164 | Good 79.7% |
| Nigerians | 64.0 /100 | #165 | Good 79.7% |
| Okinawans | 62.7 /100 | #166 | Good 79.6% |
| Immigrants | Iraq | 62.0 /100 | #167 | Good 79.6% |
| Immigrants | Indonesia | 61.8 /100 | #168 | Good 79.6% |
| Laotians | 58.4 /100 | #169 | Average 79.6% |
| Slavs | 54.0 /100 | #170 | Average 79.6% |
| Immigrants | Switzerland | 53.3 /100 | #171 | Average 79.6% |
| Immigrants | Belgium | 53.1 /100 | #172 | Average 79.6% |
| Immigrants | Scotland | 52.4 /100 | #173 | Average 79.6% |
| Syrians | 50.0 /100 | #174 | Average 79.6% |
| Cubans | 46.1 /100 | #175 | Average 79.5% |
| Australians | 46.0 /100 | #176 | Average 79.5% |
| Immigrants | Netherlands | 45.2 /100 | #177 | Average 79.5% |
Demographics Similar to Immigrants from Southern Europe by In Labor Force | Age 20-64
In terms of in labor force | age 20-64, the demographic groups most similar to Immigrants from Southern Europe are Pakistani (79.8%, a difference of 0.0%), Immigrants from Israel (79.8%, a difference of 0.010%), Slovak (79.8%, a difference of 0.010%), Immigrants from Sweden (79.8%, a difference of 0.010%), and Korean (79.8%, a difference of 0.010%).
| Demographics | Rating | Rank | In Labor Force | Age 20-64 |
| Immigrants | Spain | 83.9 /100 | #139 | Excellent 79.8% |
| Immigrants | South Eastern Asia | 80.4 /100 | #140 | Excellent 79.8% |
| Immigrants | Israel | 80.0 /100 | #141 | Good 79.8% |
| Slovaks | 79.9 /100 | #142 | Good 79.8% |
| Immigrants | Sweden | 79.7 /100 | #143 | Good 79.8% |
| Koreans | 79.6 /100 | #144 | Good 79.8% |
| Pakistanis | 79.3 /100 | #145 | Good 79.8% |
| Immigrants | Southern Europe | 78.9 /100 | #146 | Good 79.8% |
| Immigrants | Philippines | 78.0 /100 | #147 | Good 79.8% |
| Romanians | 77.6 /100 | #148 | Good 79.8% |
| Icelanders | 75.1 /100 | #149 | Good 79.7% |
| Costa Ricans | 72.4 /100 | #150 | Good 79.7% |
| Scandinavians | 72.0 /100 | #151 | Good 79.7% |
| Immigrants | Northern Europe | 72.0 /100 | #152 | Good 79.7% |
| Immigrants | Kazakhstan | 69.5 /100 | #153 | Good 79.7% |