Sierra Leonean vs Immigrants from Dominican Republic In Labor Force | Age 20-64
COMPARE
Sierra Leonean
Immigrants from Dominican Republic
In Labor Force | Age 20-64
In Labor Force | Age 20-64 Comparison
Sierra Leoneans
Immigrants from Dominican Republic
81.5%
IN LABOR FORCE | AGE 20-64
100.0/ 100
METRIC RATING
9th/ 347
METRIC RANK
77.7%
IN LABOR FORCE | AGE 20-64
0.0/ 100
METRIC RATING
296th/ 347
METRIC RANK
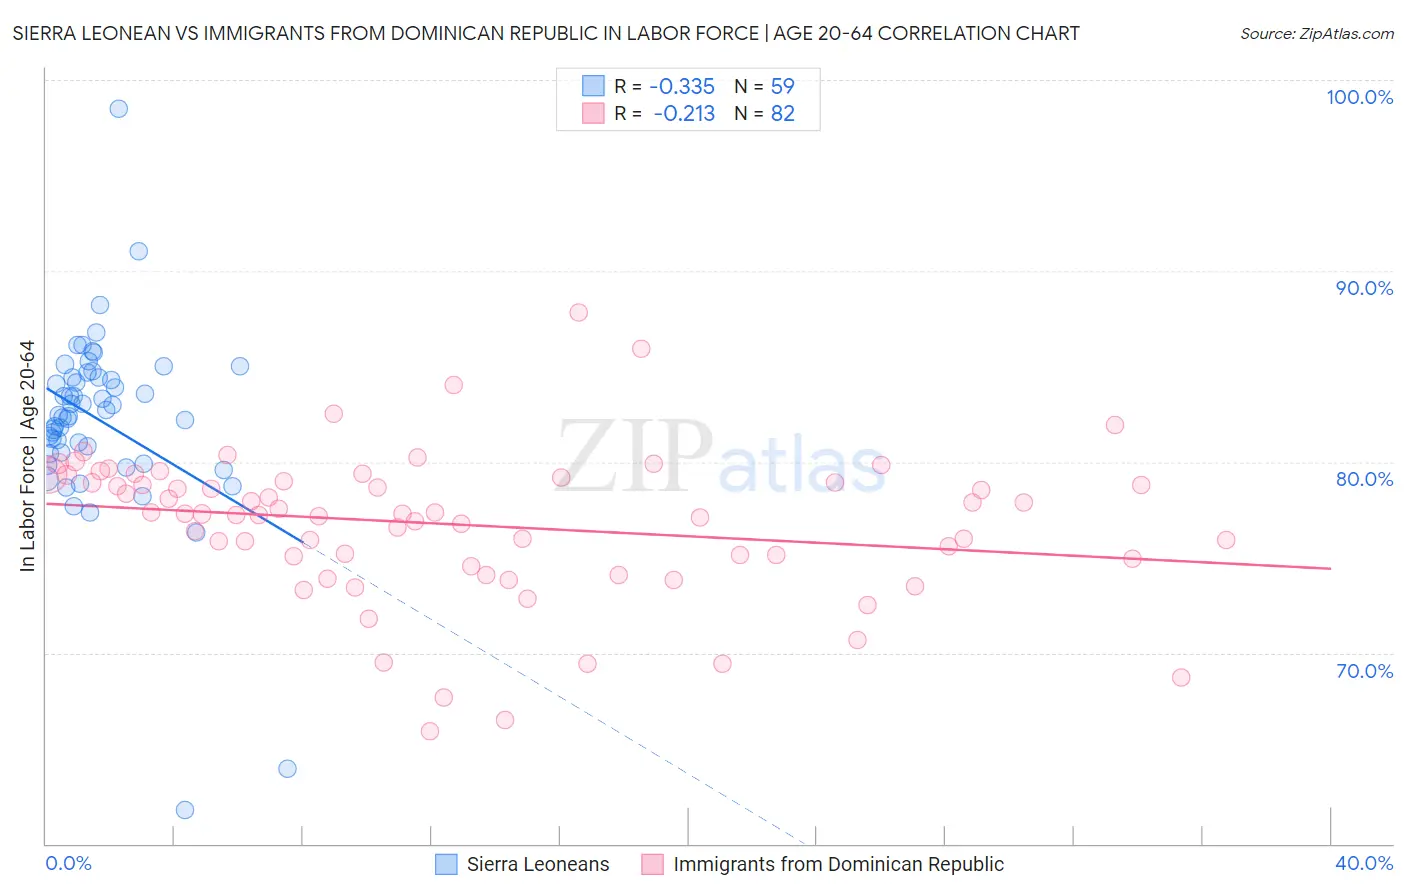
Sierra Leonean vs Immigrants from Dominican Republic In Labor Force | Age 20-64 Correlation Chart
The statistical analysis conducted on geographies consisting of 83,359,639 people shows a mild negative correlation between the proportion of Sierra Leoneans and labor force participation rate among population between the ages 20 and 64 in the United States with a correlation coefficient (R) of -0.335 and weighted average of 81.5%. Similarly, the statistical analysis conducted on geographies consisting of 275,134,528 people shows a weak negative correlation between the proportion of Immigrants from Dominican Republic and labor force participation rate among population between the ages 20 and 64 in the United States with a correlation coefficient (R) of -0.213 and weighted average of 77.7%, a difference of 5.0%.
In Labor Force | Age 20-64 Correlation Summary
| Measurement | Sierra Leonean | Immigrants from Dominican Republic |
| Minimum | 61.8% | 65.9% |
| Maximum | 98.5% | 87.8% |
| Range | 36.7% | 21.9% |
| Mean | 82.2% | 76.7% |
| Median | 82.4% | 77.3% |
| Interquartile 25% (IQ1) | 80.4% | 74.9% |
| Interquartile 75% (IQ3) | 84.4% | 79.0% |
| Interquartile Range (IQR) | 4.0% | 4.1% |
| Standard Deviation (Sample) | 5.0% | 3.9% |
| Standard Deviation (Population) | 5.0% | 3.9% |
Similar Demographics by In Labor Force | Age 20-64
Demographics Similar to Sierra Leoneans by In Labor Force | Age 20-64
In terms of in labor force | age 20-64, the demographic groups most similar to Sierra Leoneans are Immigrants from Somalia (81.6%, a difference of 0.0%), Immigrants from Cameroon (81.6%, a difference of 0.020%), Somali (81.6%, a difference of 0.060%), Immigrants from Sierra Leone (81.5%, a difference of 0.12%), and Bolivian (81.7%, a difference of 0.17%).
| Demographics | Rating | Rank | In Labor Force | Age 20-64 |
| Ethiopians | 100.0 /100 | #2 | Exceptional 82.0% |
| Immigrants | Bolivia | 100.0 /100 | #3 | Exceptional 81.9% |
| Luxembourgers | 100.0 /100 | #4 | Exceptional 81.9% |
| Bolivians | 100.0 /100 | #5 | Exceptional 81.7% |
| Somalis | 100.0 /100 | #6 | Exceptional 81.6% |
| Immigrants | Cameroon | 100.0 /100 | #7 | Exceptional 81.6% |
| Immigrants | Somalia | 100.0 /100 | #8 | Exceptional 81.6% |
| Sierra Leoneans | 100.0 /100 | #9 | Exceptional 81.5% |
| Immigrants | Sierra Leone | 100.0 /100 | #10 | Exceptional 81.5% |
| Immigrants | Eastern Africa | 100.0 /100 | #11 | Exceptional 81.3% |
| Immigrants | Eritrea | 100.0 /100 | #12 | Exceptional 81.3% |
| Immigrants | India | 100.0 /100 | #13 | Exceptional 81.3% |
| Cambodians | 100.0 /100 | #14 | Exceptional 81.1% |
| Bulgarians | 100.0 /100 | #15 | Exceptional 81.1% |
| Immigrants | Nepal | 100.0 /100 | #16 | Exceptional 81.1% |
Demographics Similar to Immigrants from Dominican Republic by In Labor Force | Age 20-64
In terms of in labor force | age 20-64, the demographic groups most similar to Immigrants from Dominican Republic are Dominican (77.7%, a difference of 0.010%), Cree (77.7%, a difference of 0.010%), Immigrants from Grenada (77.7%, a difference of 0.030%), Immigrants from Central America (77.7%, a difference of 0.070%), and Hispanic or Latino (77.6%, a difference of 0.070%).
| Demographics | Rating | Rank | In Labor Force | Age 20-64 |
| Africans | 0.0 /100 | #289 | Tragic 77.9% |
| Immigrants | Bangladesh | 0.0 /100 | #290 | Tragic 77.9% |
| Spanish Americans | 0.0 /100 | #291 | Tragic 77.8% |
| Immigrants | Azores | 0.0 /100 | #292 | Tragic 77.8% |
| Delaware | 0.0 /100 | #293 | Tragic 77.8% |
| Immigrants | Central America | 0.0 /100 | #294 | Tragic 77.7% |
| Immigrants | Grenada | 0.0 /100 | #295 | Tragic 77.7% |
| Immigrants | Dominican Republic | 0.0 /100 | #296 | Tragic 77.7% |
| Dominicans | 0.0 /100 | #297 | Tragic 77.7% |
| Cree | 0.0 /100 | #298 | Tragic 77.7% |
| Hispanics or Latinos | 0.0 /100 | #299 | Tragic 77.6% |
| Spanish American Indians | 0.0 /100 | #300 | Tragic 77.6% |
| Nepalese | 0.0 /100 | #301 | Tragic 77.5% |
| Iroquois | 0.0 /100 | #302 | Tragic 77.5% |
| Chippewa | 0.0 /100 | #303 | Tragic 77.3% |