Sierra Leonean vs Irish In Labor Force | Age 20-64
COMPARE
Sierra Leonean
Irish
In Labor Force | Age 20-64
In Labor Force | Age 20-64 Comparison
Sierra Leoneans
Irish
81.5%
IN LABOR FORCE | AGE 20-64
100.0/ 100
METRIC RATING
9th/ 347
METRIC RANK
79.3%
IN LABOR FORCE | AGE 20-64
13.2/ 100
METRIC RATING
212th/ 347
METRIC RANK
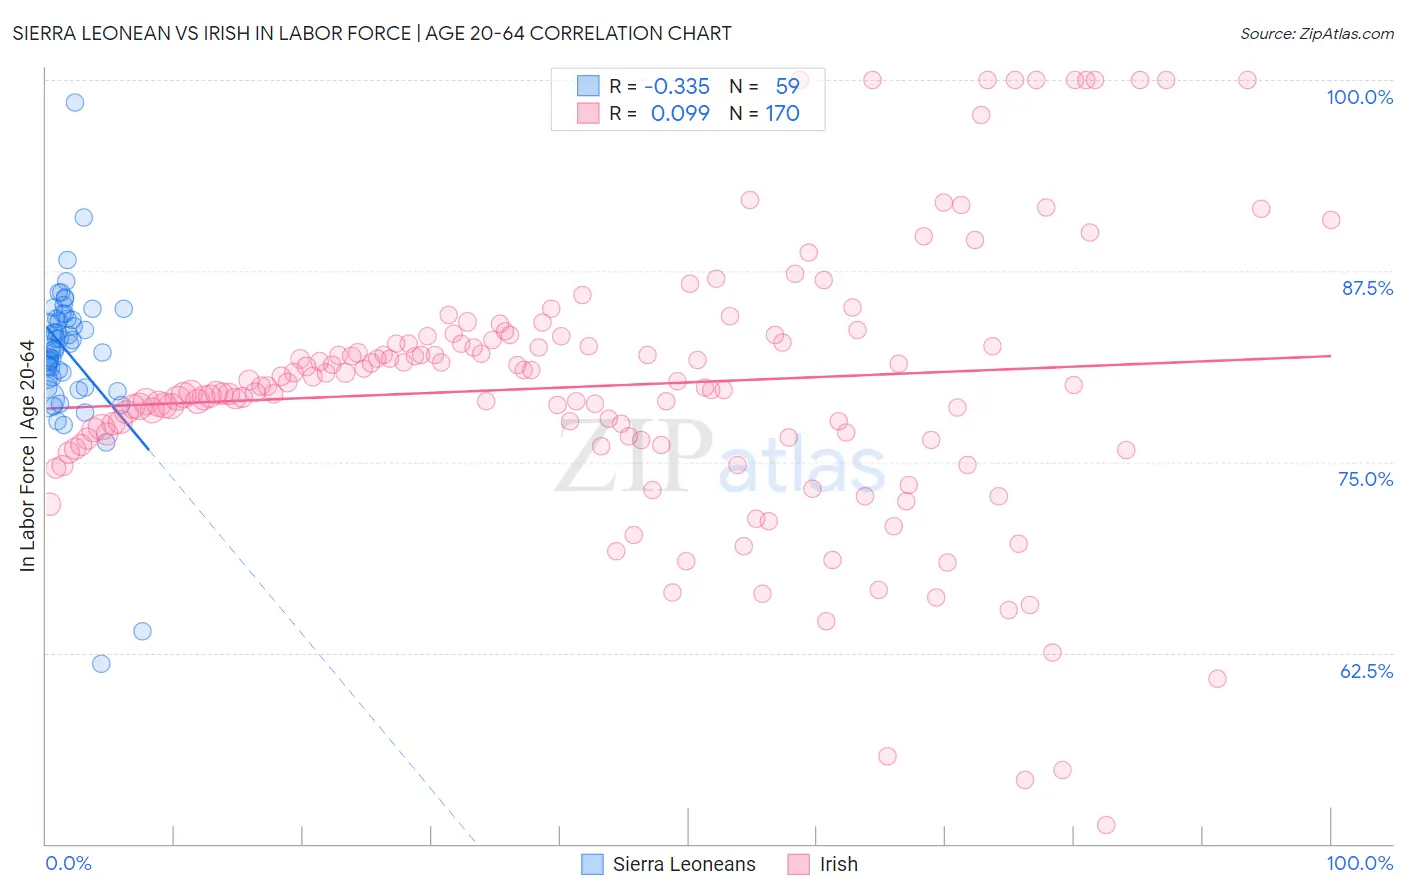
Sierra Leonean vs Irish In Labor Force | Age 20-64 Correlation Chart
The statistical analysis conducted on geographies consisting of 83,359,639 people shows a mild negative correlation between the proportion of Sierra Leoneans and labor force participation rate among population between the ages 20 and 64 in the United States with a correlation coefficient (R) of -0.335 and weighted average of 81.5%. Similarly, the statistical analysis conducted on geographies consisting of 580,689,060 people shows a slight positive correlation between the proportion of Irish and labor force participation rate among population between the ages 20 and 64 in the United States with a correlation coefficient (R) of 0.099 and weighted average of 79.3%, a difference of 2.9%.
In Labor Force | Age 20-64 Correlation Summary
| Measurement | Sierra Leonean | Irish |
| Minimum | 61.8% | 51.2% |
| Maximum | 98.5% | 100.0% |
| Range | 36.7% | 48.8% |
| Mean | 82.2% | 80.0% |
| Median | 82.4% | 79.9% |
| Interquartile 25% (IQ1) | 80.4% | 76.5% |
| Interquartile 75% (IQ3) | 84.4% | 82.8% |
| Interquartile Range (IQR) | 4.0% | 6.3% |
| Standard Deviation (Sample) | 5.0% | 8.8% |
| Standard Deviation (Population) | 5.0% | 8.8% |
Similar Demographics by In Labor Force | Age 20-64
Demographics Similar to Sierra Leoneans by In Labor Force | Age 20-64
In terms of in labor force | age 20-64, the demographic groups most similar to Sierra Leoneans are Immigrants from Somalia (81.6%, a difference of 0.0%), Immigrants from Cameroon (81.6%, a difference of 0.020%), Somali (81.6%, a difference of 0.060%), Immigrants from Sierra Leone (81.5%, a difference of 0.12%), and Bolivian (81.7%, a difference of 0.17%).
| Demographics | Rating | Rank | In Labor Force | Age 20-64 |
| Ethiopians | 100.0 /100 | #2 | Exceptional 82.0% |
| Immigrants | Bolivia | 100.0 /100 | #3 | Exceptional 81.9% |
| Luxembourgers | 100.0 /100 | #4 | Exceptional 81.9% |
| Bolivians | 100.0 /100 | #5 | Exceptional 81.7% |
| Somalis | 100.0 /100 | #6 | Exceptional 81.6% |
| Immigrants | Cameroon | 100.0 /100 | #7 | Exceptional 81.6% |
| Immigrants | Somalia | 100.0 /100 | #8 | Exceptional 81.6% |
| Sierra Leoneans | 100.0 /100 | #9 | Exceptional 81.5% |
| Immigrants | Sierra Leone | 100.0 /100 | #10 | Exceptional 81.5% |
| Immigrants | Eastern Africa | 100.0 /100 | #11 | Exceptional 81.3% |
| Immigrants | Eritrea | 100.0 /100 | #12 | Exceptional 81.3% |
| Immigrants | India | 100.0 /100 | #13 | Exceptional 81.3% |
| Cambodians | 100.0 /100 | #14 | Exceptional 81.1% |
| Bulgarians | 100.0 /100 | #15 | Exceptional 81.1% |
| Immigrants | Nepal | 100.0 /100 | #16 | Exceptional 81.1% |
Demographics Similar to Irish by In Labor Force | Age 20-64
In terms of in labor force | age 20-64, the demographic groups most similar to Irish are Immigrants from Portugal (79.3%, a difference of 0.010%), Immigrants from Armenia (79.2%, a difference of 0.020%), Immigrants from Norway (79.2%, a difference of 0.020%), Arab (79.2%, a difference of 0.030%), and European (79.3%, a difference of 0.040%).
| Demographics | Rating | Rank | In Labor Force | Age 20-64 |
| Immigrants | Congo | 17.5 /100 | #205 | Poor 79.3% |
| Immigrants | Ecuador | 16.9 /100 | #206 | Poor 79.3% |
| Sub-Saharan Africans | 16.5 /100 | #207 | Poor 79.3% |
| British | 16.5 /100 | #208 | Poor 79.3% |
| Bangladeshis | 16.4 /100 | #209 | Poor 79.3% |
| Haitians | 16.1 /100 | #210 | Poor 79.3% |
| Europeans | 15.3 /100 | #211 | Poor 79.3% |
| Irish | 13.2 /100 | #212 | Poor 79.3% |
| Immigrants | Portugal | 12.8 /100 | #213 | Poor 79.3% |
| Immigrants | Armenia | 12.2 /100 | #214 | Poor 79.2% |
| Immigrants | Norway | 12.0 /100 | #215 | Poor 79.2% |
| Arabs | 11.4 /100 | #216 | Poor 79.2% |
| Immigrants | Western Asia | 11.0 /100 | #217 | Poor 79.2% |
| Immigrants | England | 9.3 /100 | #218 | Tragic 79.2% |
| French Canadians | 8.4 /100 | #219 | Tragic 79.2% |