Shoshone vs Immigrants from Dominican Republic In Labor Force | Age 20-64
COMPARE
Shoshone
Immigrants from Dominican Republic
In Labor Force | Age 20-64
In Labor Force | Age 20-64 Comparison
Shoshone
Immigrants from Dominican Republic
76.8%
IN LABOR FORCE | AGE 20-64
0.0/ 100
METRIC RATING
313th/ 347
METRIC RANK
77.7%
IN LABOR FORCE | AGE 20-64
0.0/ 100
METRIC RATING
296th/ 347
METRIC RANK
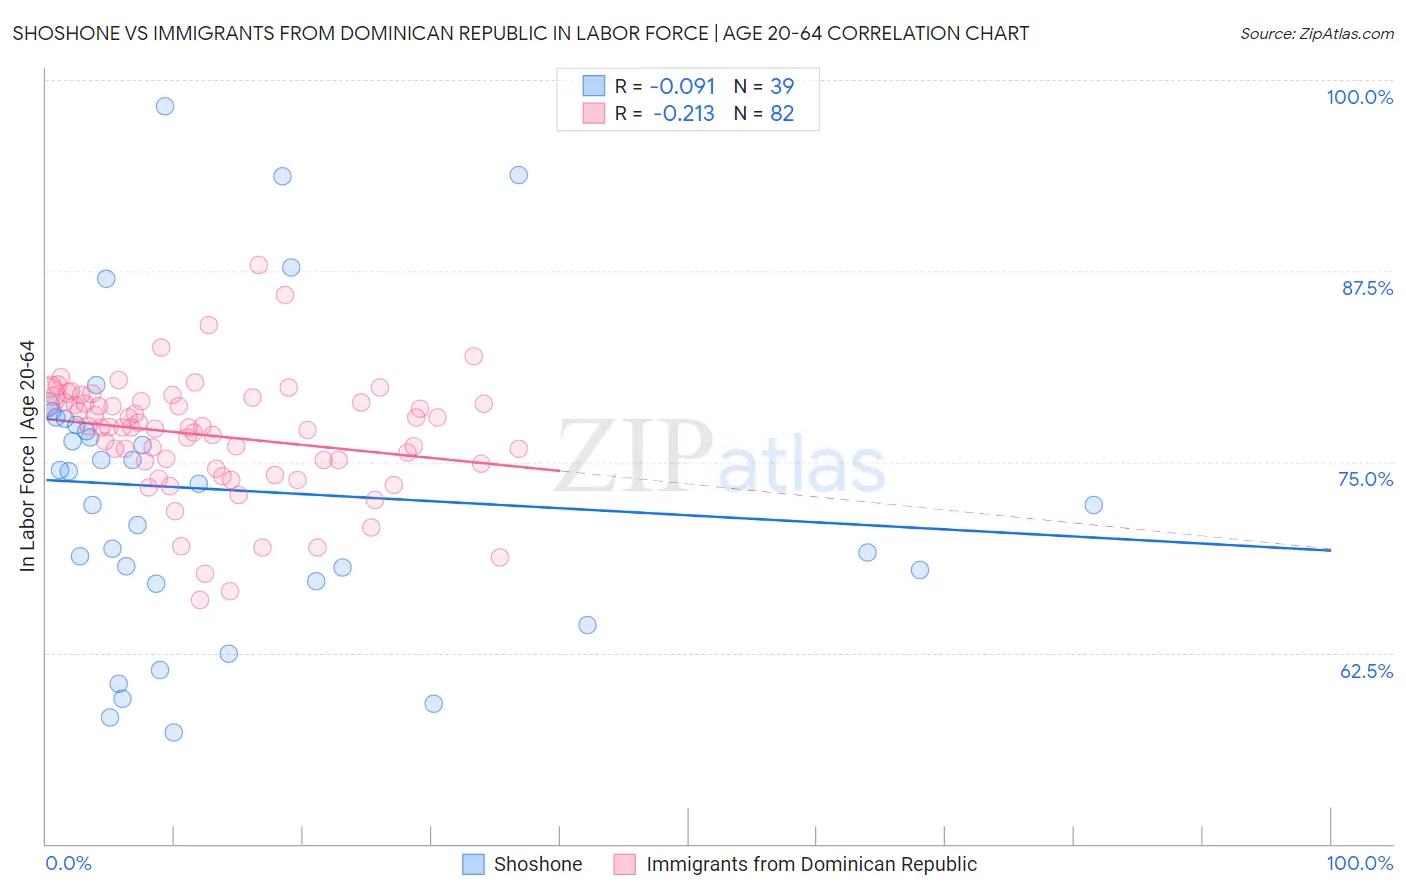
Shoshone vs Immigrants from Dominican Republic In Labor Force | Age 20-64 Correlation Chart
The statistical analysis conducted on geographies consisting of 66,627,303 people shows a slight negative correlation between the proportion of Shoshone and labor force participation rate among population between the ages 20 and 64 in the United States with a correlation coefficient (R) of -0.091 and weighted average of 76.8%. Similarly, the statistical analysis conducted on geographies consisting of 275,134,528 people shows a weak negative correlation between the proportion of Immigrants from Dominican Republic and labor force participation rate among population between the ages 20 and 64 in the United States with a correlation coefficient (R) of -0.213 and weighted average of 77.7%, a difference of 1.1%.
In Labor Force | Age 20-64 Correlation Summary
| Measurement | Shoshone | Immigrants from Dominican Republic |
| Minimum | 57.3% | 65.9% |
| Maximum | 98.3% | 87.8% |
| Range | 41.0% | 21.9% |
| Mean | 73.2% | 76.7% |
| Median | 73.6% | 77.3% |
| Interquartile 25% (IQ1) | 67.2% | 74.9% |
| Interquartile 75% (IQ3) | 77.8% | 79.0% |
| Interquartile Range (IQR) | 10.6% | 4.1% |
| Standard Deviation (Sample) | 9.8% | 3.9% |
| Standard Deviation (Population) | 9.7% | 3.9% |
Demographics Similar to Shoshone and Immigrants from Dominican Republic by In Labor Force | Age 20-64
In terms of in labor force | age 20-64, the demographic groups most similar to Shoshone are Black/African American (76.8%, a difference of 0.020%), Alaskan Athabascan (76.9%, a difference of 0.12%), Blackfeet (77.0%, a difference of 0.29%), Comanche (77.0%, a difference of 0.32%), and American (77.0%, a difference of 0.34%). Similarly, the demographic groups most similar to Immigrants from Dominican Republic are Dominican (77.7%, a difference of 0.010%), Cree (77.7%, a difference of 0.010%), Immigrants from Grenada (77.7%, a difference of 0.030%), Immigrants from Central America (77.7%, a difference of 0.070%), and Hispanic or Latino (77.6%, a difference of 0.070%).
| Demographics | Rating | Rank | In Labor Force | Age 20-64 |
| Immigrants | Central America | 0.0 /100 | #294 | Tragic 77.7% |
| Immigrants | Grenada | 0.0 /100 | #295 | Tragic 77.7% |
| Immigrants | Dominican Republic | 0.0 /100 | #296 | Tragic 77.7% |
| Dominicans | 0.0 /100 | #297 | Tragic 77.7% |
| Cree | 0.0 /100 | #298 | Tragic 77.7% |
| Hispanics or Latinos | 0.0 /100 | #299 | Tragic 77.6% |
| Spanish American Indians | 0.0 /100 | #300 | Tragic 77.6% |
| Nepalese | 0.0 /100 | #301 | Tragic 77.5% |
| Iroquois | 0.0 /100 | #302 | Tragic 77.5% |
| Chippewa | 0.0 /100 | #303 | Tragic 77.3% |
| Immigrants | Mexico | 0.0 /100 | #304 | Tragic 77.3% |
| Mexicans | 0.0 /100 | #305 | Tragic 77.2% |
| Potawatomi | 0.0 /100 | #306 | Tragic 77.2% |
| Central American Indians | 0.0 /100 | #307 | Tragic 77.1% |
| Alaska Natives | 0.0 /100 | #308 | Tragic 77.0% |
| Americans | 0.0 /100 | #309 | Tragic 77.0% |
| Comanche | 0.0 /100 | #310 | Tragic 77.0% |
| Blackfeet | 0.0 /100 | #311 | Tragic 77.0% |
| Alaskan Athabascans | 0.0 /100 | #312 | Tragic 76.9% |
| Shoshone | 0.0 /100 | #313 | Tragic 76.8% |
| Blacks/African Americans | 0.0 /100 | #314 | Tragic 76.8% |