Immigrants from South Africa vs Immigrants from Northern Europe In Labor Force | Age > 16
COMPARE
Immigrants from South Africa
Immigrants from Northern Europe
In Labor Force | Age > 16
In Labor Force | Age > 16 Comparison
Immigrants from South Africa
Immigrants from Northern Europe
65.3%
IN LABOR FORCE | AGE > 16
73.5/ 100
METRIC RATING
160th/ 347
METRIC RANK
64.7%
IN LABOR FORCE | AGE > 16
7.2/ 100
METRIC RATING
231st/ 347
METRIC RANK
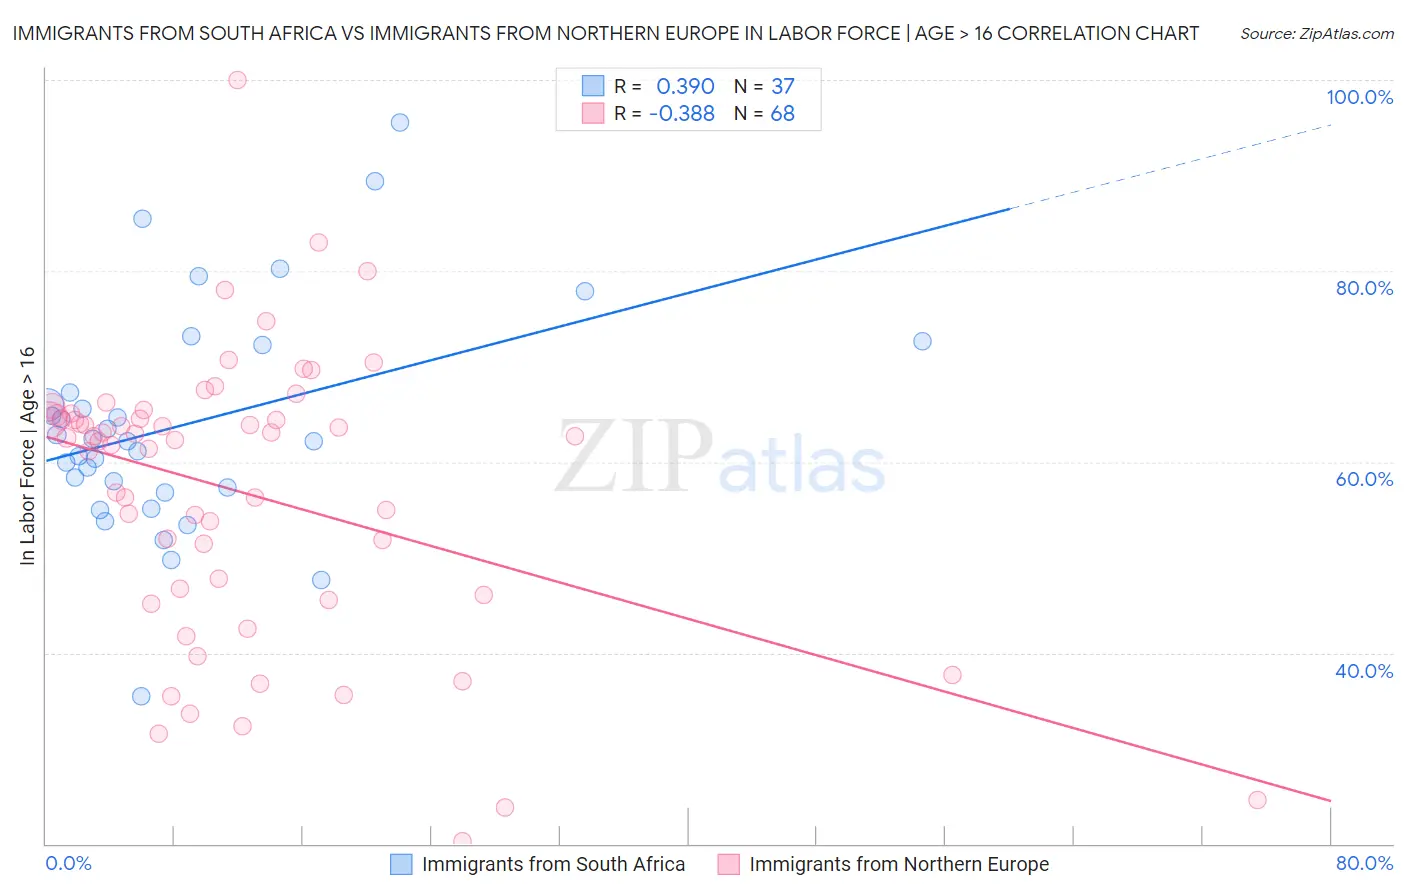
Immigrants from South Africa vs Immigrants from Northern Europe In Labor Force | Age > 16 Correlation Chart
The statistical analysis conducted on geographies consisting of 233,322,326 people shows a mild positive correlation between the proportion of Immigrants from South Africa and labor force participation rate among population ages 16 and over in the United States with a correlation coefficient (R) of 0.390 and weighted average of 65.3%. Similarly, the statistical analysis conducted on geographies consisting of 477,244,389 people shows a mild negative correlation between the proportion of Immigrants from Northern Europe and labor force participation rate among population ages 16 and over in the United States with a correlation coefficient (R) of -0.388 and weighted average of 64.7%, a difference of 1.0%.
In Labor Force | Age > 16 Correlation Summary
| Measurement | Immigrants from South Africa | Immigrants from Northern Europe |
| Minimum | 35.5% | 20.3% |
| Maximum | 95.6% | 100.0% |
| Range | 60.1% | 79.7% |
| Mean | 63.9% | 56.8% |
| Median | 62.1% | 62.4% |
| Interquartile 25% (IQ1) | 57.1% | 46.4% |
| Interquartile 75% (IQ3) | 69.8% | 64.7% |
| Interquartile Range (IQR) | 12.7% | 18.3% |
| Standard Deviation (Sample) | 11.9% | 14.9% |
| Standard Deviation (Population) | 11.7% | 14.8% |
Similar Demographics by In Labor Force | Age > 16
Demographics Similar to Immigrants from South Africa by In Labor Force | Age > 16
In terms of in labor force | age > 16, the demographic groups most similar to Immigrants from South Africa are Immigrants from Syria (65.3%, a difference of 0.020%), Immigrants from Russia (65.3%, a difference of 0.030%), Panamanian (65.3%, a difference of 0.030%), Australian (65.3%, a difference of 0.030%), and Immigrants from Ireland (65.3%, a difference of 0.040%).
| Demographics | Rating | Rank | In Labor Force | Age > 16 |
| Immigrants | China | 80.5 /100 | #153 | Excellent 65.4% |
| Immigrants | Eastern Europe | 78.3 /100 | #154 | Good 65.4% |
| Immigrants | Armenia | 76.6 /100 | #155 | Good 65.3% |
| Immigrants | Ireland | 75.9 /100 | #156 | Good 65.3% |
| Immigrants | Russia | 75.7 /100 | #157 | Good 65.3% |
| Panamanians | 75.2 /100 | #158 | Good 65.3% |
| Immigrants | Syria | 74.6 /100 | #159 | Good 65.3% |
| Immigrants | South Africa | 73.5 /100 | #160 | Good 65.3% |
| Australians | 71.3 /100 | #161 | Good 65.3% |
| Albanians | 70.8 /100 | #162 | Good 65.3% |
| South Africans | 69.8 /100 | #163 | Good 65.3% |
| Danes | 68.8 /100 | #164 | Good 65.3% |
| Immigrants | Kazakhstan | 68.1 /100 | #165 | Good 65.3% |
| Immigrants | Western Asia | 67.3 /100 | #166 | Good 65.3% |
| Immigrants | Belarus | 66.0 /100 | #167 | Good 65.2% |
Demographics Similar to Immigrants from Northern Europe by In Labor Force | Age > 16
In terms of in labor force | age > 16, the demographic groups most similar to Immigrants from Northern Europe are British (64.7%, a difference of 0.0%), Chinese (64.7%, a difference of 0.0%), European (64.7%, a difference of 0.040%), Polish (64.7%, a difference of 0.040%), and Northern European (64.7%, a difference of 0.040%).
| Demographics | Rating | Rank | In Labor Force | Age > 16 |
| Immigrants | Jamaica | 8.8 /100 | #224 | Tragic 64.7% |
| Croatians | 8.8 /100 | #225 | Tragic 64.7% |
| Europeans | 8.3 /100 | #226 | Tragic 64.7% |
| Poles | 8.3 /100 | #227 | Tragic 64.7% |
| Northern Europeans | 8.2 /100 | #228 | Tragic 64.7% |
| British | 7.3 /100 | #229 | Tragic 64.7% |
| Chinese | 7.3 /100 | #230 | Tragic 64.7% |
| Immigrants | Northern Europe | 7.2 /100 | #231 | Tragic 64.7% |
| Africans | 5.8 /100 | #232 | Tragic 64.6% |
| Slavs | 4.9 /100 | #233 | Tragic 64.6% |
| Vietnamese | 4.7 /100 | #234 | Tragic 64.6% |
| Austrians | 4.6 /100 | #235 | Tragic 64.6% |
| Immigrants | Norway | 4.6 /100 | #236 | Tragic 64.6% |
| Italians | 4.6 /100 | #237 | Tragic 64.6% |
| Lebanese | 3.9 /100 | #238 | Tragic 64.5% |