Shoshone vs Menominee In Labor Force | Age 45-54
COMPARE
Shoshone
Menominee
In Labor Force | Age 45-54
In Labor Force | Age 45-54 Comparison
Shoshone
Menominee
79.3%
IN LABOR FORCE | AGE 45-54
0.0/ 100
METRIC RATING
316th/ 347
METRIC RANK
77.4%
IN LABOR FORCE | AGE 45-54
0.0/ 100
METRIC RATING
332nd/ 347
METRIC RANK
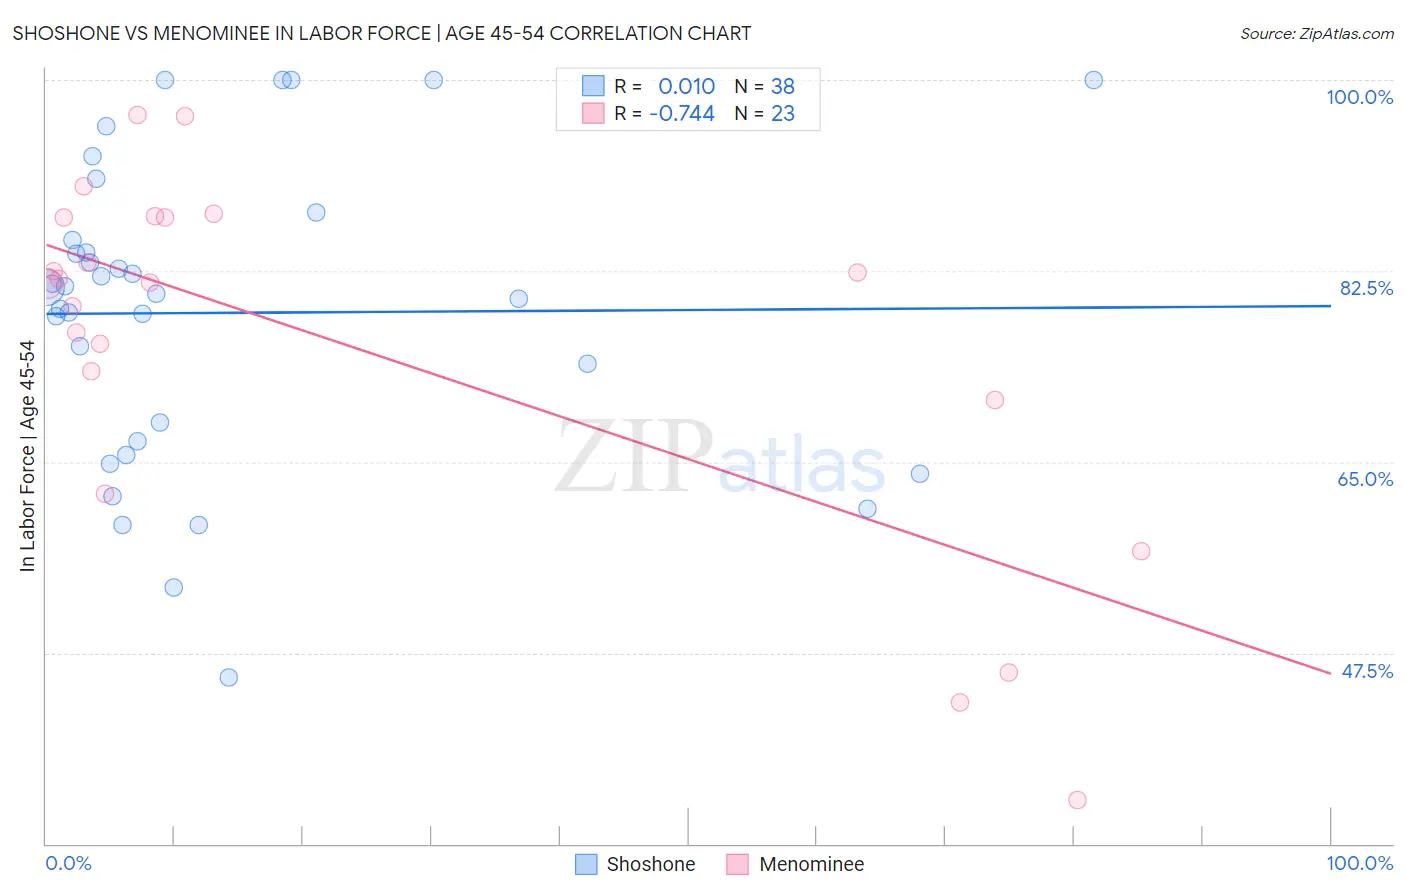
Shoshone vs Menominee In Labor Force | Age 45-54 Correlation Chart
The statistical analysis conducted on geographies consisting of 66,619,718 people shows no correlation between the proportion of Shoshone and labor force participation rate among population between the ages 45 and 54 in the United States with a correlation coefficient (R) of 0.010 and weighted average of 79.3%. Similarly, the statistical analysis conducted on geographies consisting of 45,777,282 people shows a strong negative correlation between the proportion of Menominee and labor force participation rate among population between the ages 45 and 54 in the United States with a correlation coefficient (R) of -0.744 and weighted average of 77.4%, a difference of 2.4%.
In Labor Force | Age 45-54 Correlation Summary
| Measurement | Shoshone | Menominee |
| Minimum | 45.2% | 34.0% |
| Maximum | 100.0% | 96.8% |
| Range | 54.8% | 62.8% |
| Mean | 78.7% | 75.8% |
| Median | 80.7% | 81.4% |
| Interquartile 25% (IQ1) | 66.9% | 70.7% |
| Interquartile 75% (IQ3) | 85.3% | 87.4% |
| Interquartile Range (IQR) | 18.4% | 16.7% |
| Standard Deviation (Sample) | 13.9% | 16.8% |
| Standard Deviation (Population) | 13.7% | 16.4% |
Demographics Similar to Shoshone and Menominee by In Labor Force | Age 45-54
In terms of in labor force | age 45-54, the demographic groups most similar to Shoshone are Black/African American (79.3%, a difference of 0.080%), Comanche (79.2%, a difference of 0.13%), Ottawa (79.5%, a difference of 0.22%), Chickasaw (79.0%, a difference of 0.31%), and Cherokee (79.0%, a difference of 0.41%). Similarly, the demographic groups most similar to Menominee are Tsimshian (77.4%, a difference of 0.030%), Cheyenne (77.6%, a difference of 0.18%), Native/Alaskan (77.1%, a difference of 0.36%), Apache (77.1%, a difference of 0.36%), and Creek (77.7%, a difference of 0.41%).
| Demographics | Rating | Rank | In Labor Force | Age 45-54 |
| Ottawa | 0.0 /100 | #314 | Tragic 79.5% |
| Blacks/African Americans | 0.0 /100 | #315 | Tragic 79.3% |
| Shoshone | 0.0 /100 | #316 | Tragic 79.3% |
| Comanche | 0.0 /100 | #317 | Tragic 79.2% |
| Chickasaw | 0.0 /100 | #318 | Tragic 79.0% |
| Cherokee | 0.0 /100 | #319 | Tragic 79.0% |
| Yaqui | 0.0 /100 | #320 | Tragic 78.9% |
| Yup'ik | 0.0 /100 | #321 | Tragic 78.6% |
| Crow | 0.0 /100 | #322 | Tragic 78.3% |
| Kiowa | 0.0 /100 | #323 | Tragic 78.3% |
| Dutch West Indians | 0.0 /100 | #324 | Tragic 78.2% |
| Choctaw | 0.0 /100 | #325 | Tragic 78.2% |
| Seminole | 0.0 /100 | #326 | Tragic 78.1% |
| Cajuns | 0.0 /100 | #327 | Tragic 78.1% |
| Sioux | 0.0 /100 | #328 | Tragic 78.0% |
| Creek | 0.0 /100 | #329 | Tragic 77.7% |
| Cheyenne | 0.0 /100 | #330 | Tragic 77.6% |
| Tsimshian | 0.0 /100 | #331 | Tragic 77.4% |
| Menominee | 0.0 /100 | #332 | Tragic 77.4% |
| Natives/Alaskans | 0.0 /100 | #333 | Tragic 77.1% |
| Apache | 0.0 /100 | #334 | Tragic 77.1% |