Canadian vs Immigrants from Eastern Europe In Labor Force | Age 25-29
COMPARE
Canadian
Immigrants from Eastern Europe
In Labor Force | Age 25-29
In Labor Force | Age 25-29 Comparison
Canadians
Immigrants from Eastern Europe
84.7%
IN LABOR FORCE | AGE 25-29
58.5/ 100
METRIC RATING
161st/ 347
METRIC RANK
85.2%
IN LABOR FORCE | AGE 25-29
96.8/ 100
METRIC RATING
84th/ 347
METRIC RANK
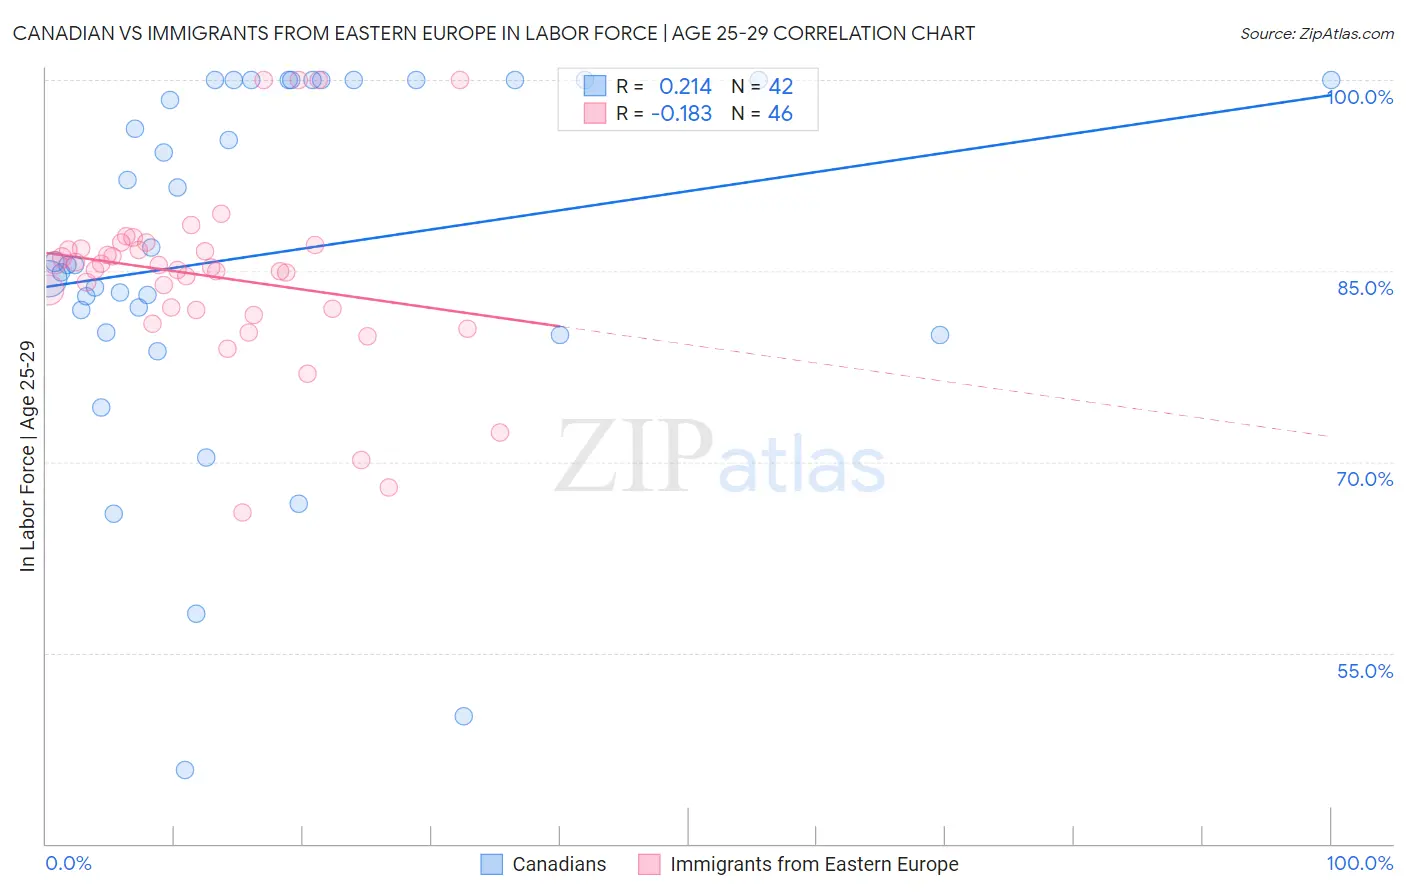
Canadian vs Immigrants from Eastern Europe In Labor Force | Age 25-29 Correlation Chart
The statistical analysis conducted on geographies consisting of 437,288,132 people shows a weak positive correlation between the proportion of Canadians and labor force participation rate among population between the ages 25 and 29 in the United States with a correlation coefficient (R) of 0.214 and weighted average of 84.7%. Similarly, the statistical analysis conducted on geographies consisting of 475,521,938 people shows a poor negative correlation between the proportion of Immigrants from Eastern Europe and labor force participation rate among population between the ages 25 and 29 in the United States with a correlation coefficient (R) of -0.183 and weighted average of 85.2%, a difference of 0.56%.
In Labor Force | Age 25-29 Correlation Summary
| Measurement | Canadian | Immigrants from Eastern Europe |
| Minimum | 45.8% | 66.0% |
| Maximum | 100.0% | 100.0% |
| Range | 54.2% | 34.0% |
| Mean | 86.4% | 84.6% |
| Median | 85.6% | 85.2% |
| Interquartile 25% (IQ1) | 80.2% | 81.9% |
| Interquartile 75% (IQ3) | 100.0% | 86.7% |
| Interquartile Range (IQR) | 19.8% | 4.8% |
| Standard Deviation (Sample) | 14.1% | 7.0% |
| Standard Deviation (Population) | 13.9% | 7.0% |
Similar Demographics by In Labor Force | Age 25-29
Demographics Similar to Canadians by In Labor Force | Age 25-29
In terms of in labor force | age 25-29, the demographic groups most similar to Canadians are Immigrants from Peru (84.7%, a difference of 0.0%), Immigrants from Colombia (84.7%, a difference of 0.0%), Argentinean (84.7%, a difference of 0.0%), British (84.7%, a difference of 0.010%), and Immigrants from Ghana (84.7%, a difference of 0.010%).
| Demographics | Rating | Rank | In Labor Force | Age 25-29 |
| Immigrants | Sri Lanka | 61.7 /100 | #154 | Good 84.7% |
| Indians (Asian) | 61.6 /100 | #155 | Good 84.7% |
| French | 61.0 /100 | #156 | Good 84.7% |
| British | 60.4 /100 | #157 | Good 84.7% |
| Immigrants | Ghana | 60.2 /100 | #158 | Good 84.7% |
| Immigrants | Western Africa | 60.1 /100 | #159 | Good 84.7% |
| Immigrants | Peru | 58.6 /100 | #160 | Average 84.7% |
| Canadians | 58.5 /100 | #161 | Average 84.7% |
| Immigrants | Colombia | 58.3 /100 | #162 | Average 84.7% |
| Argentineans | 57.9 /100 | #163 | Average 84.7% |
| Ghanaians | 57.6 /100 | #164 | Average 84.7% |
| Immigrants | Burma/Myanmar | 57.4 /100 | #165 | Average 84.7% |
| Immigrants | Spain | 56.9 /100 | #166 | Average 84.7% |
| Indonesians | 56.5 /100 | #167 | Average 84.7% |
| South Americans | 54.9 /100 | #168 | Average 84.7% |
Demographics Similar to Immigrants from Eastern Europe by In Labor Force | Age 25-29
In terms of in labor force | age 25-29, the demographic groups most similar to Immigrants from Eastern Europe are Immigrants from Europe (85.2%, a difference of 0.0%), Immigrants from Africa (85.2%, a difference of 0.0%), Okinawan (85.2%, a difference of 0.010%), Ukrainian (85.2%, a difference of 0.010%), and French Canadian (85.2%, a difference of 0.010%).
| Demographics | Rating | Rank | In Labor Force | Age 25-29 |
| Immigrants | South Central Asia | 97.9 /100 | #77 | Exceptional 85.2% |
| Immigrants | Egypt | 97.7 /100 | #78 | Exceptional 85.2% |
| Immigrants | Northern Africa | 97.6 /100 | #79 | Exceptional 85.2% |
| Immigrants | Zimbabwe | 97.6 /100 | #80 | Exceptional 85.2% |
| Immigrants | Northern Europe | 97.2 /100 | #81 | Exceptional 85.2% |
| Okinawans | 97.0 /100 | #82 | Exceptional 85.2% |
| Immigrants | Europe | 96.8 /100 | #83 | Exceptional 85.2% |
| Immigrants | Eastern Europe | 96.8 /100 | #84 | Exceptional 85.2% |
| Immigrants | Africa | 96.7 /100 | #85 | Exceptional 85.2% |
| Ukrainians | 96.7 /100 | #86 | Exceptional 85.2% |
| French Canadians | 96.5 /100 | #87 | Exceptional 85.2% |
| Immigrants | Croatia | 96.4 /100 | #88 | Exceptional 85.2% |
| Immigrants | France | 96.3 /100 | #89 | Exceptional 85.2% |
| Burmese | 95.9 /100 | #90 | Exceptional 85.1% |
| Immigrants | Moldova | 95.8 /100 | #91 | Exceptional 85.1% |