Serbian vs Immigrants from Singapore In Labor Force | Age 20-24
COMPARE
Serbian
Immigrants from Singapore
In Labor Force | Age 20-24
In Labor Force | Age 20-24 Comparison
Serbians
Immigrants from Singapore
77.3%
IN LABOR FORCE | AGE 20-24
100.0/ 100
METRIC RATING
48th/ 347
METRIC RANK
72.4%
IN LABOR FORCE | AGE 20-24
0.0/ 100
METRIC RATING
305th/ 347
METRIC RANK
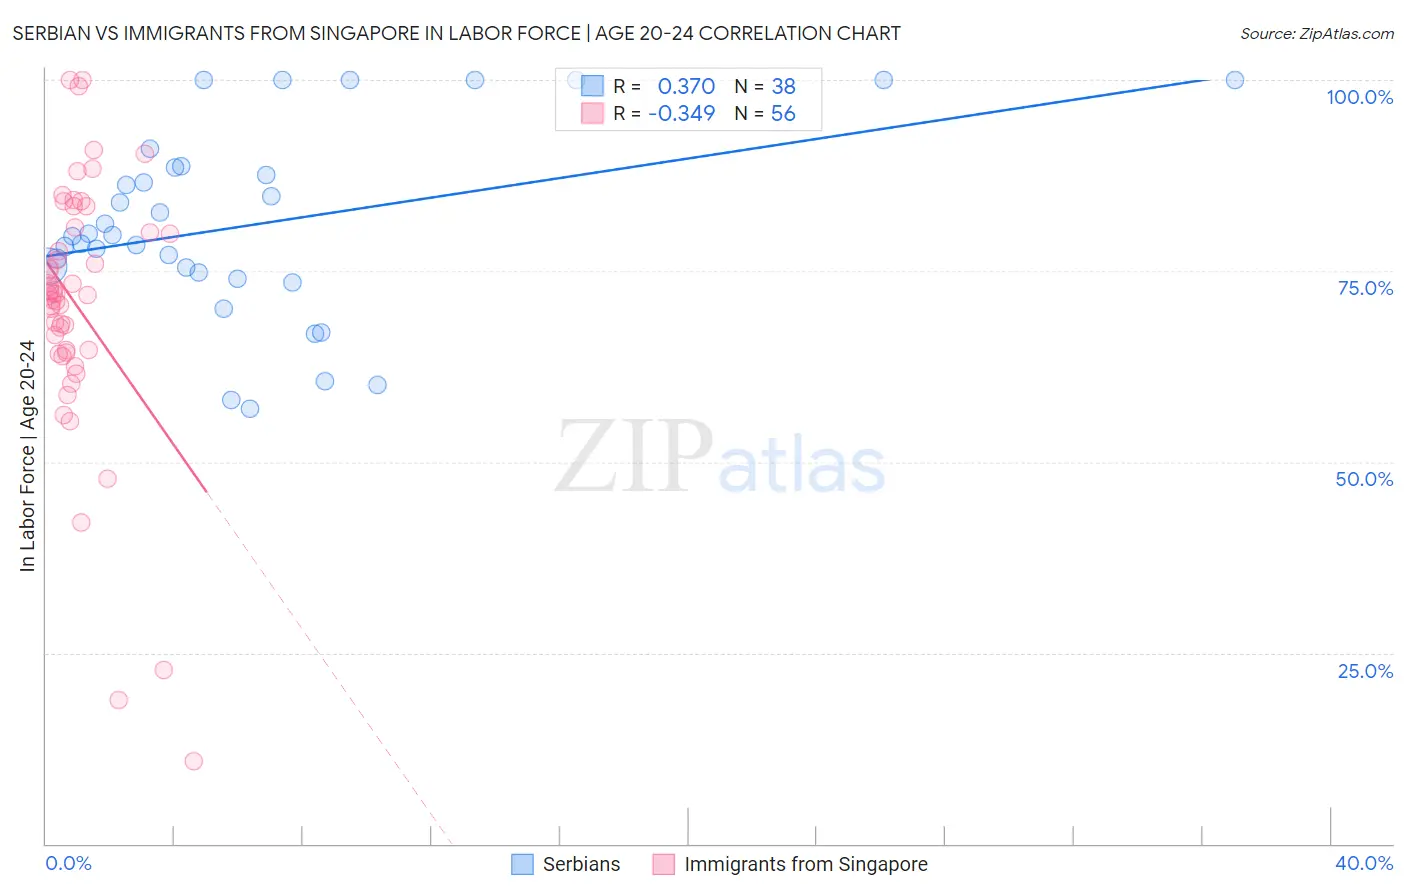
Serbian vs Immigrants from Singapore In Labor Force | Age 20-24 Correlation Chart
The statistical analysis conducted on geographies consisting of 267,532,940 people shows a mild positive correlation between the proportion of Serbians and labor force participation rate among population between the ages 20 and 24 in the United States with a correlation coefficient (R) of 0.370 and weighted average of 77.3%. Similarly, the statistical analysis conducted on geographies consisting of 137,517,565 people shows a mild negative correlation between the proportion of Immigrants from Singapore and labor force participation rate among population between the ages 20 and 24 in the United States with a correlation coefficient (R) of -0.349 and weighted average of 72.4%, a difference of 6.7%.
In Labor Force | Age 20-24 Correlation Summary
| Measurement | Serbian | Immigrants from Singapore |
| Minimum | 56.9% | 10.8% |
| Maximum | 100.0% | 100.0% |
| Range | 43.1% | 89.2% |
| Mean | 81.0% | 70.4% |
| Median | 79.6% | 71.9% |
| Interquartile 25% (IQ1) | 74.7% | 64.5% |
| Interquartile 75% (IQ3) | 88.5% | 80.3% |
| Interquartile Range (IQR) | 13.7% | 15.9% |
| Standard Deviation (Sample) | 12.3% | 17.3% |
| Standard Deviation (Population) | 12.2% | 17.2% |
Similar Demographics by In Labor Force | Age 20-24
Demographics Similar to Serbians by In Labor Force | Age 20-24
In terms of in labor force | age 20-24, the demographic groups most similar to Serbians are Chinese (77.3%, a difference of 0.010%), Ethiopian (77.3%, a difference of 0.050%), Malaysian (77.2%, a difference of 0.050%), Croatian (77.2%, a difference of 0.060%), and Indonesian (77.2%, a difference of 0.060%).
| Demographics | Rating | Rank | In Labor Force | Age 20-24 |
| Immigrants | Congo | 100.0 /100 | #41 | Exceptional 77.4% |
| French | 100.0 /100 | #42 | Exceptional 77.4% |
| Immigrants | Laos | 100.0 /100 | #43 | Exceptional 77.4% |
| Fijians | 100.0 /100 | #44 | Exceptional 77.4% |
| Native Hawaiians | 100.0 /100 | #45 | Exceptional 77.4% |
| Samoans | 100.0 /100 | #46 | Exceptional 77.4% |
| Ethiopians | 100.0 /100 | #47 | Exceptional 77.3% |
| Serbians | 100.0 /100 | #48 | Exceptional 77.3% |
| Chinese | 100.0 /100 | #49 | Exceptional 77.3% |
| Malaysians | 100.0 /100 | #50 | Exceptional 77.2% |
| Croatians | 100.0 /100 | #51 | Exceptional 77.2% |
| Indonesians | 100.0 /100 | #52 | Exceptional 77.2% |
| Immigrants | Azores | 100.0 /100 | #53 | Exceptional 77.2% |
| Celtics | 99.9 /100 | #54 | Exceptional 77.1% |
| Immigrants | Liberia | 99.9 /100 | #55 | Exceptional 77.1% |
Demographics Similar to Immigrants from Singapore by In Labor Force | Age 20-24
In terms of in labor force | age 20-24, the demographic groups most similar to Immigrants from Singapore are Immigrants from Jamaica (72.4%, a difference of 0.020%), Immigrants from West Indies (72.4%, a difference of 0.030%), Ecuadorian (72.4%, a difference of 0.040%), Native/Alaskan (72.4%, a difference of 0.050%), and Cuban (72.5%, a difference of 0.14%).
| Demographics | Rating | Rank | In Labor Force | Age 20-24 |
| Israelis | 0.0 /100 | #298 | Tragic 72.6% |
| Iranians | 0.0 /100 | #299 | Tragic 72.6% |
| Armenians | 0.0 /100 | #300 | Tragic 72.5% |
| Cubans | 0.0 /100 | #301 | Tragic 72.5% |
| Natives/Alaskans | 0.0 /100 | #302 | Tragic 72.4% |
| Ecuadorians | 0.0 /100 | #303 | Tragic 72.4% |
| Immigrants | West Indies | 0.0 /100 | #304 | Tragic 72.4% |
| Immigrants | Singapore | 0.0 /100 | #305 | Tragic 72.4% |
| Immigrants | Jamaica | 0.0 /100 | #306 | Tragic 72.4% |
| Immigrants | Ecuador | 0.0 /100 | #307 | Tragic 72.3% |
| Soviet Union | 0.0 /100 | #308 | Tragic 72.3% |
| Tsimshian | 0.0 /100 | #309 | Tragic 72.3% |
| Immigrants | Cuba | 0.0 /100 | #310 | Tragic 72.0% |
| Apache | 0.0 /100 | #311 | Tragic 72.0% |
| Immigrants | Caribbean | 0.0 /100 | #312 | Tragic 71.9% |