Senegalese vs Immigrants from Bahamas In Labor Force | Age 20-64
COMPARE
Senegalese
Immigrants from Bahamas
In Labor Force | Age 20-64
In Labor Force | Age 20-64 Comparison
Senegalese
Immigrants from Bahamas
79.7%
IN LABOR FORCE | AGE 20-64
69.1/ 100
METRIC RATING
156th/ 347
METRIC RANK
78.2%
IN LABOR FORCE | AGE 20-64
0.0/ 100
METRIC RATING
277th/ 347
METRIC RANK
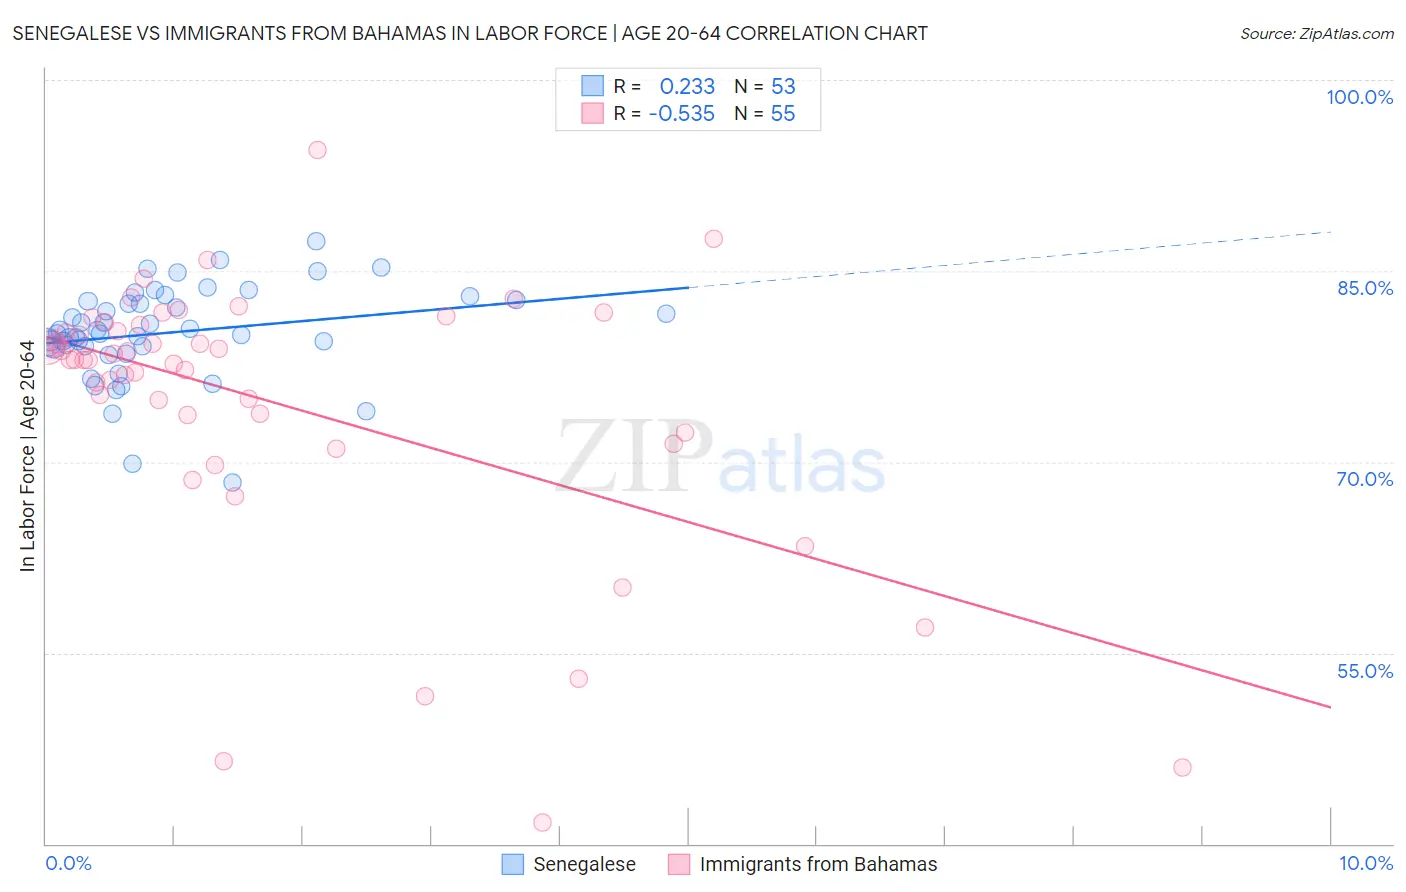
Senegalese vs Immigrants from Bahamas In Labor Force | Age 20-64 Correlation Chart
The statistical analysis conducted on geographies consisting of 78,141,567 people shows a weak positive correlation between the proportion of Senegalese and labor force participation rate among population between the ages 20 and 64 in the United States with a correlation coefficient (R) of 0.233 and weighted average of 79.7%. Similarly, the statistical analysis conducted on geographies consisting of 104,666,072 people shows a substantial negative correlation between the proportion of Immigrants from Bahamas and labor force participation rate among population between the ages 20 and 64 in the United States with a correlation coefficient (R) of -0.535 and weighted average of 78.2%, a difference of 1.9%.
In Labor Force | Age 20-64 Correlation Summary
| Measurement | Senegalese | Immigrants from Bahamas |
| Minimum | 68.4% | 41.7% |
| Maximum | 87.3% | 94.5% |
| Range | 18.9% | 52.8% |
| Mean | 80.2% | 74.7% |
| Median | 80.1% | 78.0% |
| Interquartile 25% (IQ1) | 79.0% | 72.3% |
| Interquartile 75% (IQ3) | 82.7% | 80.8% |
| Interquartile Range (IQR) | 3.6% | 8.5% |
| Standard Deviation (Sample) | 3.7% | 10.7% |
| Standard Deviation (Population) | 3.7% | 10.6% |
Similar Demographics by In Labor Force | Age 20-64
Demographics Similar to Senegalese by In Labor Force | Age 20-64
In terms of in labor force | age 20-64, the demographic groups most similar to Senegalese are Immigrants from Kazakhstan (79.7%, a difference of 0.0%), New Zealander (79.7%, a difference of 0.0%), Immigrants from South Africa (79.7%, a difference of 0.0%), Immigrants from China (79.7%, a difference of 0.0%), and Austrian (79.7%, a difference of 0.010%).
| Demographics | Rating | Rank | In Labor Force | Age 20-64 |
| Icelanders | 75.1 /100 | #149 | Good 79.7% |
| Costa Ricans | 72.4 /100 | #150 | Good 79.7% |
| Scandinavians | 72.0 /100 | #151 | Good 79.7% |
| Immigrants | Northern Europe | 72.0 /100 | #152 | Good 79.7% |
| Immigrants | Kazakhstan | 69.5 /100 | #153 | Good 79.7% |
| New Zealanders | 69.4 /100 | #154 | Good 79.7% |
| Immigrants | South Africa | 69.2 /100 | #155 | Good 79.7% |
| Senegalese | 69.1 /100 | #156 | Good 79.7% |
| Immigrants | China | 69.1 /100 | #157 | Good 79.7% |
| Austrians | 67.6 /100 | #158 | Good 79.7% |
| Immigrants | Cuba | 66.7 /100 | #159 | Good 79.7% |
| Moroccans | 66.7 /100 | #160 | Good 79.7% |
| South Africans | 66.2 /100 | #161 | Good 79.7% |
| Germans | 65.2 /100 | #162 | Good 79.7% |
| Immigrants | Costa Rica | 64.6 /100 | #163 | Good 79.7% |
Demographics Similar to Immigrants from Bahamas by In Labor Force | Age 20-64
In terms of in labor force | age 20-64, the demographic groups most similar to Immigrants from Bahamas are Mexican American Indian (78.2%, a difference of 0.0%), Puget Sound Salish (78.2%, a difference of 0.010%), Aleut (78.2%, a difference of 0.020%), Spanish (78.2%, a difference of 0.020%), and French American Indian (78.2%, a difference of 0.050%).
| Demographics | Rating | Rank | In Labor Force | Age 20-64 |
| Scotch-Irish | 0.0 /100 | #270 | Tragic 78.3% |
| Immigrants | Latin America | 0.0 /100 | #271 | Tragic 78.3% |
| Marshallese | 0.0 /100 | #272 | Tragic 78.3% |
| French American Indians | 0.0 /100 | #273 | Tragic 78.2% |
| Aleuts | 0.0 /100 | #274 | Tragic 78.2% |
| Spanish | 0.0 /100 | #275 | Tragic 78.2% |
| Puget Sound Salish | 0.0 /100 | #276 | Tragic 78.2% |
| Immigrants | Bahamas | 0.0 /100 | #277 | Tragic 78.2% |
| Mexican American Indians | 0.0 /100 | #278 | Tragic 78.2% |
| Belizeans | 0.0 /100 | #279 | Tragic 78.2% |
| Immigrants | Dominica | 0.0 /100 | #280 | Tragic 78.1% |
| Guyanese | 0.0 /100 | #281 | Tragic 78.1% |
| Immigrants | St. Vincent and the Grenadines | 0.0 /100 | #282 | Tragic 78.1% |
| Immigrants | Nonimmigrants | 0.0 /100 | #283 | Tragic 78.1% |
| Immigrants | Guyana | 0.0 /100 | #284 | Tragic 78.1% |