Senegalese vs Immigrants from Turkey In Labor Force | Age 45-54
COMPARE
Senegalese
Immigrants from Turkey
In Labor Force | Age 45-54
In Labor Force | Age 45-54 Comparison
Senegalese
Immigrants from Turkey
82.4%
IN LABOR FORCE | AGE 45-54
9.5/ 100
METRIC RATING
205th/ 347
METRIC RANK
83.6%
IN LABOR FORCE | AGE 45-54
98.8/ 100
METRIC RATING
51st/ 347
METRIC RANK
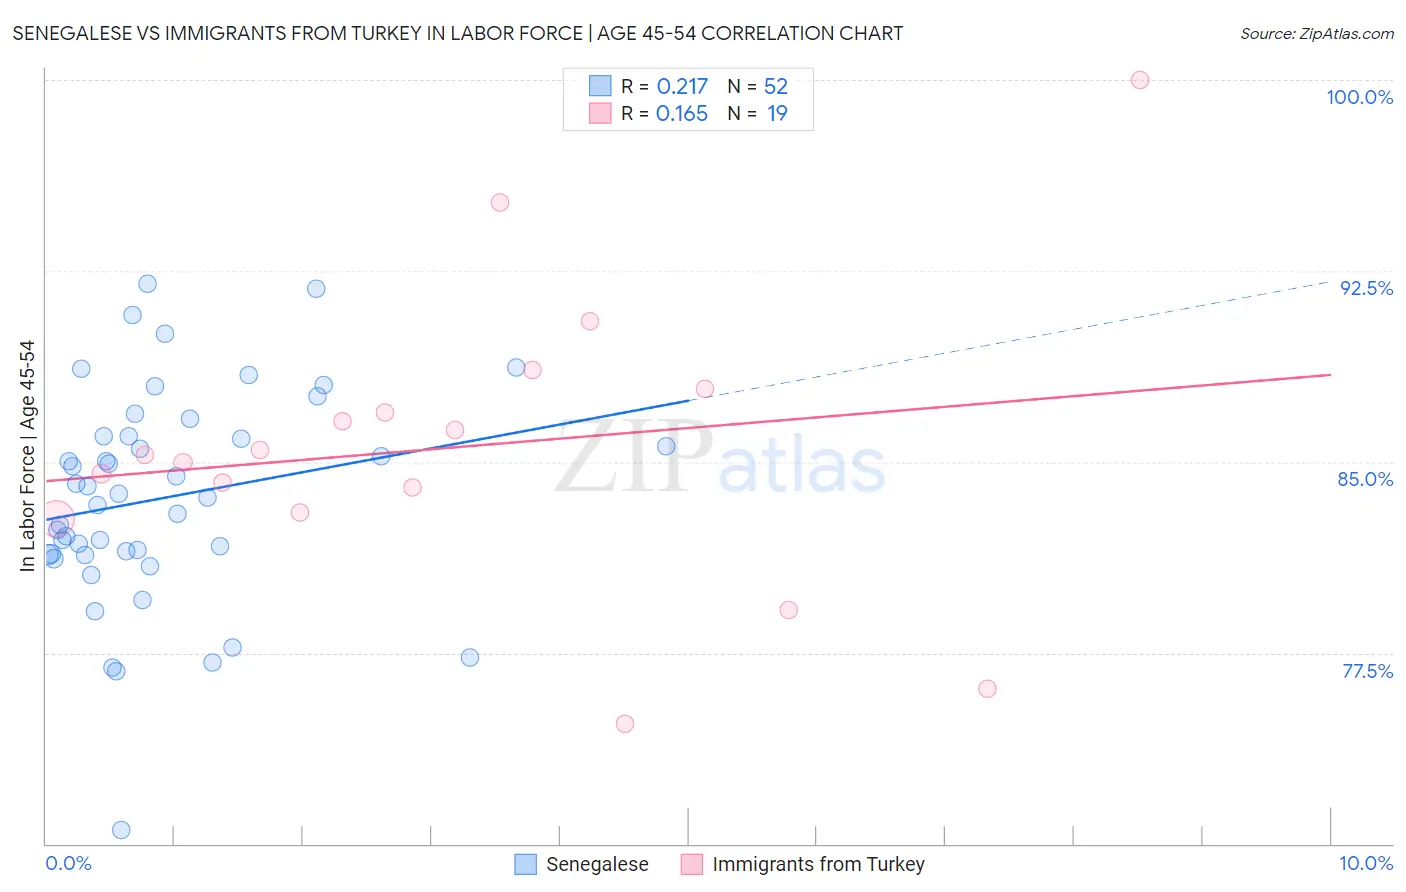
Senegalese vs Immigrants from Turkey In Labor Force | Age 45-54 Correlation Chart
The statistical analysis conducted on geographies consisting of 78,115,825 people shows a weak positive correlation between the proportion of Senegalese and labor force participation rate among population between the ages 45 and 54 in the United States with a correlation coefficient (R) of 0.217 and weighted average of 82.4%. Similarly, the statistical analysis conducted on geographies consisting of 222,959,363 people shows a poor positive correlation between the proportion of Immigrants from Turkey and labor force participation rate among population between the ages 45 and 54 in the United States with a correlation coefficient (R) of 0.165 and weighted average of 83.6%, a difference of 1.5%.
In Labor Force | Age 45-54 Correlation Summary
| Measurement | Senegalese | Immigrants from Turkey |
| Minimum | 70.5% | 74.7% |
| Maximum | 92.0% | 100.0% |
| Range | 21.5% | 25.3% |
| Mean | 83.6% | 85.6% |
| Median | 83.7% | 85.3% |
| Interquartile 25% (IQ1) | 81.4% | 83.0% |
| Interquartile 75% (IQ3) | 86.0% | 87.9% |
| Interquartile Range (IQR) | 4.6% | 4.9% |
| Standard Deviation (Sample) | 4.2% | 5.8% |
| Standard Deviation (Population) | 4.1% | 5.7% |
Similar Demographics by In Labor Force | Age 45-54
Demographics Similar to Senegalese by In Labor Force | Age 45-54
In terms of in labor force | age 45-54, the demographic groups most similar to Senegalese are Welsh (82.3%, a difference of 0.010%), Immigrants from Western Europe (82.4%, a difference of 0.030%), Immigrants from Cabo Verde (82.3%, a difference of 0.030%), Native Hawaiian (82.3%, a difference of 0.030%), and Arab (82.4%, a difference of 0.050%).
| Demographics | Rating | Rank | In Labor Force | Age 45-54 |
| Immigrants | Denmark | 17.9 /100 | #198 | Poor 82.5% |
| Moroccans | 15.7 /100 | #199 | Poor 82.5% |
| French Canadians | 15.4 /100 | #200 | Poor 82.5% |
| Canadians | 15.1 /100 | #201 | Poor 82.4% |
| Immigrants | Western Asia | 14.9 /100 | #202 | Poor 82.4% |
| Arabs | 11.6 /100 | #203 | Poor 82.4% |
| Immigrants | Western Europe | 10.9 /100 | #204 | Poor 82.4% |
| Senegalese | 9.5 /100 | #205 | Tragic 82.4% |
| Welsh | 9.2 /100 | #206 | Tragic 82.3% |
| Immigrants | Cabo Verde | 8.6 /100 | #207 | Tragic 82.3% |
| Native Hawaiians | 8.5 /100 | #208 | Tragic 82.3% |
| Immigrants | Lebanon | 7.4 /100 | #209 | Tragic 82.3% |
| Immigrants | Bahamas | 7.1 /100 | #210 | Tragic 82.3% |
| Immigrants | Syria | 6.6 /100 | #211 | Tragic 82.3% |
| Ecuadorians | 6.3 /100 | #212 | Tragic 82.3% |
Demographics Similar to Immigrants from Turkey by In Labor Force | Age 45-54
In terms of in labor force | age 45-54, the demographic groups most similar to Immigrants from Turkey are Polish (83.6%, a difference of 0.0%), Peruvian (83.6%, a difference of 0.0%), Immigrants from Greece (83.6%, a difference of 0.010%), Somali (83.5%, a difference of 0.010%), and Macedonian (83.5%, a difference of 0.020%).
| Demographics | Rating | Rank | In Labor Force | Age 45-54 |
| Burmese | 99.1 /100 | #44 | Exceptional 83.6% |
| Immigrants | Hong Kong | 99.1 /100 | #45 | Exceptional 83.6% |
| Lithuanians | 99.1 /100 | #46 | Exceptional 83.6% |
| Croatians | 99.0 /100 | #47 | Exceptional 83.6% |
| Immigrants | Poland | 99.0 /100 | #48 | Exceptional 83.6% |
| Immigrants | Morocco | 99.0 /100 | #49 | Exceptional 83.6% |
| Immigrants | Greece | 98.8 /100 | #50 | Exceptional 83.6% |
| Immigrants | Turkey | 98.8 /100 | #51 | Exceptional 83.6% |
| Poles | 98.7 /100 | #52 | Exceptional 83.6% |
| Peruvians | 98.7 /100 | #53 | Exceptional 83.6% |
| Somalis | 98.7 /100 | #54 | Exceptional 83.5% |
| Macedonians | 98.7 /100 | #55 | Exceptional 83.5% |
| Immigrants | Peru | 98.6 /100 | #56 | Exceptional 83.5% |
| Paraguayans | 98.5 /100 | #57 | Exceptional 83.5% |
| Eastern Europeans | 98.5 /100 | #58 | Exceptional 83.5% |