Senegalese vs Immigrants from Oceania In Labor Force | Age 45-54
COMPARE
Senegalese
Immigrants from Oceania
In Labor Force | Age 45-54
In Labor Force | Age 45-54 Comparison
Senegalese
Immigrants from Oceania
82.4%
IN LABOR FORCE | AGE 45-54
9.5/ 100
METRIC RATING
205th/ 347
METRIC RANK
82.1%
IN LABOR FORCE | AGE 45-54
2.5/ 100
METRIC RATING
225th/ 347
METRIC RANK
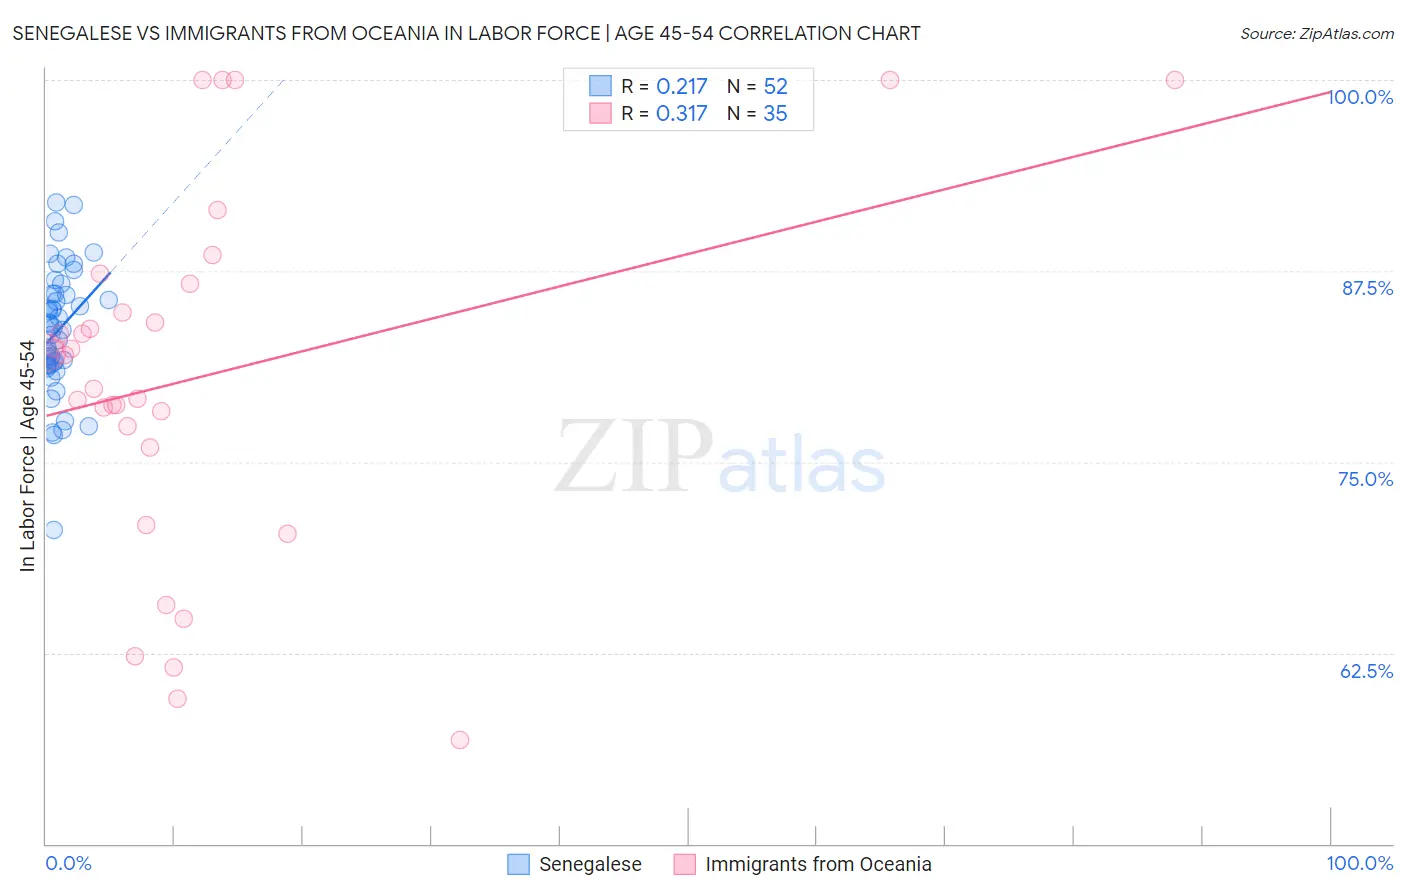
Senegalese vs Immigrants from Oceania In Labor Force | Age 45-54 Correlation Chart
The statistical analysis conducted on geographies consisting of 78,115,825 people shows a weak positive correlation between the proportion of Senegalese and labor force participation rate among population between the ages 45 and 54 in the United States with a correlation coefficient (R) of 0.217 and weighted average of 82.4%. Similarly, the statistical analysis conducted on geographies consisting of 305,368,221 people shows a mild positive correlation between the proportion of Immigrants from Oceania and labor force participation rate among population between the ages 45 and 54 in the United States with a correlation coefficient (R) of 0.317 and weighted average of 82.1%, a difference of 0.32%.
In Labor Force | Age 45-54 Correlation Summary
| Measurement | Senegalese | Immigrants from Oceania |
| Minimum | 70.5% | 56.8% |
| Maximum | 92.0% | 100.0% |
| Range | 21.5% | 43.2% |
| Mean | 83.6% | 80.6% |
| Median | 83.7% | 82.0% |
| Interquartile 25% (IQ1) | 81.4% | 75.9% |
| Interquartile 75% (IQ3) | 86.0% | 86.7% |
| Interquartile Range (IQR) | 4.6% | 10.8% |
| Standard Deviation (Sample) | 4.2% | 11.7% |
| Standard Deviation (Population) | 4.1% | 11.5% |
Demographics Similar to Senegalese and Immigrants from Oceania by In Labor Force | Age 45-54
In terms of in labor force | age 45-54, the demographic groups most similar to Senegalese are Welsh (82.3%, a difference of 0.010%), Immigrants from Cabo Verde (82.3%, a difference of 0.030%), Native Hawaiian (82.3%, a difference of 0.030%), Immigrants from Lebanon (82.3%, a difference of 0.060%), and Immigrants from Bahamas (82.3%, a difference of 0.070%). Similarly, the demographic groups most similar to Immigrants from Oceania are Immigrants from Jamaica (82.1%, a difference of 0.020%), Immigrants (82.1%, a difference of 0.050%), Immigrants from Ecuador (82.2%, a difference of 0.070%), Bahamian (82.2%, a difference of 0.080%), and Panamanian (82.2%, a difference of 0.080%).
| Demographics | Rating | Rank | In Labor Force | Age 45-54 |
| Senegalese | 9.5 /100 | #205 | Tragic 82.4% |
| Welsh | 9.2 /100 | #206 | Tragic 82.3% |
| Immigrants | Cabo Verde | 8.6 /100 | #207 | Tragic 82.3% |
| Native Hawaiians | 8.5 /100 | #208 | Tragic 82.3% |
| Immigrants | Lebanon | 7.4 /100 | #209 | Tragic 82.3% |
| Immigrants | Bahamas | 7.1 /100 | #210 | Tragic 82.3% |
| Immigrants | Syria | 6.6 /100 | #211 | Tragic 82.3% |
| Ecuadorians | 6.3 /100 | #212 | Tragic 82.3% |
| Immigrants | Uzbekistan | 5.8 /100 | #213 | Tragic 82.3% |
| Immigrants | Panama | 5.6 /100 | #214 | Tragic 82.2% |
| Iraqis | 5.6 /100 | #215 | Tragic 82.2% |
| Scottish | 5.3 /100 | #216 | Tragic 82.2% |
| Portuguese | 4.7 /100 | #217 | Tragic 82.2% |
| English | 4.4 /100 | #218 | Tragic 82.2% |
| French | 4.1 /100 | #219 | Tragic 82.2% |
| Bahamians | 3.6 /100 | #220 | Tragic 82.2% |
| Panamanians | 3.5 /100 | #221 | Tragic 82.2% |
| Immigrants | Ecuador | 3.4 /100 | #222 | Tragic 82.2% |
| Immigrants | Immigrants | 3.1 /100 | #223 | Tragic 82.1% |
| Immigrants | Jamaica | 2.7 /100 | #224 | Tragic 82.1% |
| Immigrants | Oceania | 2.5 /100 | #225 | Tragic 82.1% |