Seminole vs Austrian In Labor Force | Age 20-24
COMPARE
Seminole
Austrian
In Labor Force | Age 20-24
In Labor Force | Age 20-24 Comparison
Seminole
Austrians
74.3%
IN LABOR FORCE | AGE 20-24
6.9/ 100
METRIC RATING
224th/ 347
METRIC RANK
76.5%
IN LABOR FORCE | AGE 20-24
99.4/ 100
METRIC RATING
84th/ 347
METRIC RANK
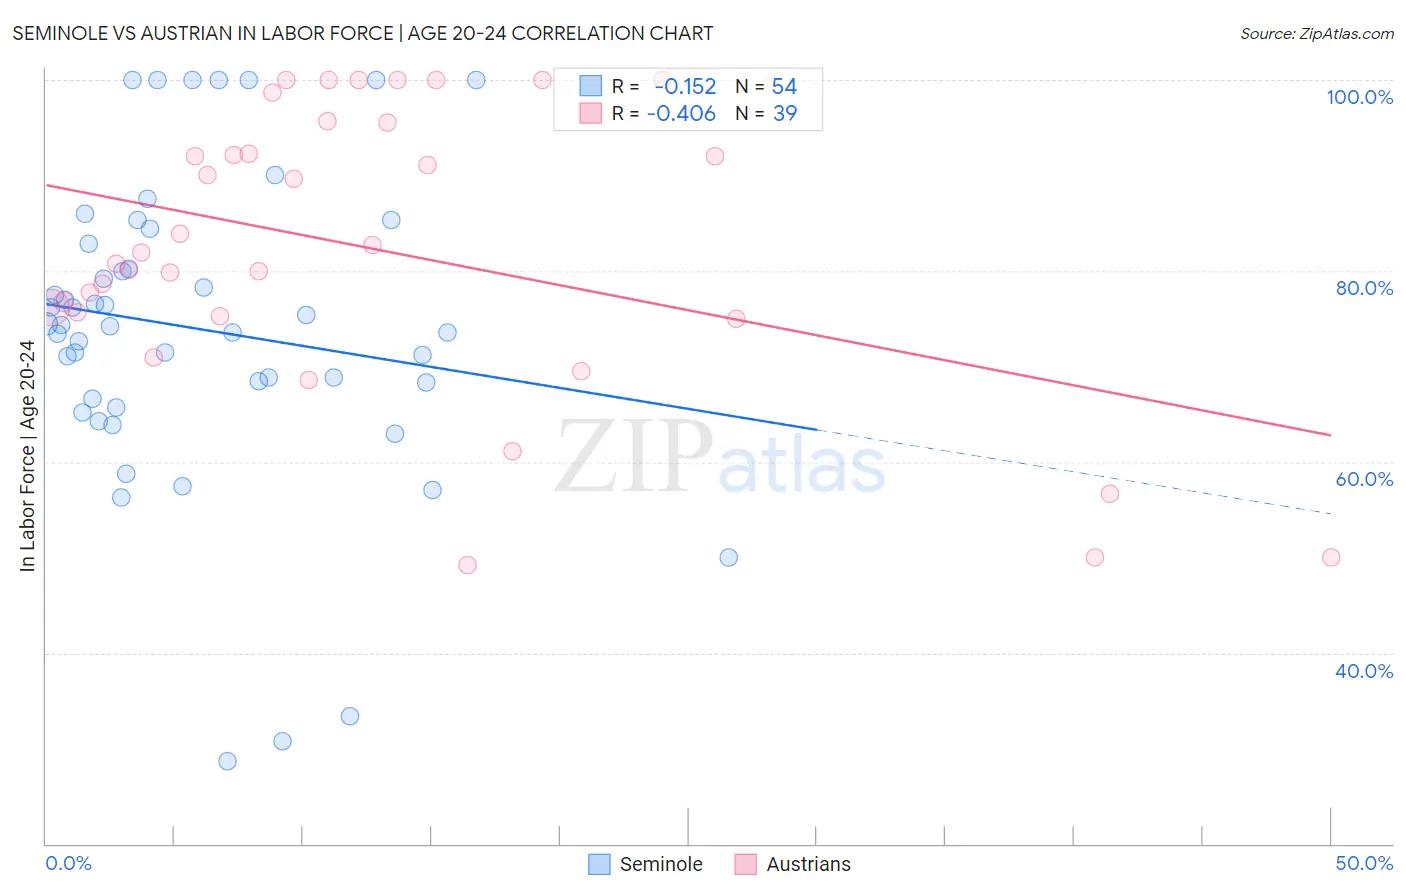
Seminole vs Austrian In Labor Force | Age 20-24 Correlation Chart
The statistical analysis conducted on geographies consisting of 118,300,066 people shows a poor negative correlation between the proportion of Seminole and labor force participation rate among population between the ages 20 and 24 in the United States with a correlation coefficient (R) of -0.152 and weighted average of 74.3%. Similarly, the statistical analysis conducted on geographies consisting of 451,655,464 people shows a moderate negative correlation between the proportion of Austrians and labor force participation rate among population between the ages 20 and 24 in the United States with a correlation coefficient (R) of -0.406 and weighted average of 76.5%, a difference of 2.9%.
In Labor Force | Age 20-24 Correlation Summary
| Measurement | Seminole | Austrian |
| Minimum | 28.6% | 49.2% |
| Maximum | 100.0% | 100.0% |
| Range | 71.4% | 50.8% |
| Mean | 73.9% | 82.3% |
| Median | 74.3% | 81.9% |
| Interquartile 25% (IQ1) | 66.6% | 75.3% |
| Interquartile 75% (IQ3) | 82.9% | 95.6% |
| Interquartile Range (IQR) | 16.3% | 20.3% |
| Standard Deviation (Sample) | 16.2% | 14.9% |
| Standard Deviation (Population) | 16.0% | 14.7% |
Similar Demographics by In Labor Force | Age 20-24
Demographics Similar to Seminole by In Labor Force | Age 20-24
In terms of in labor force | age 20-24, the demographic groups most similar to Seminole are Ghanaian (74.3%, a difference of 0.040%), Hispanic or Latino (74.4%, a difference of 0.060%), Immigrants from Fiji (74.3%, a difference of 0.060%), Immigrants from Ireland (74.3%, a difference of 0.070%), and Immigrants from Ukraine (74.2%, a difference of 0.12%).
| Demographics | Rating | Rank | In Labor Force | Age 20-24 |
| Chileans | 12.5 /100 | #217 | Poor 74.5% |
| Immigrants | Peru | 10.6 /100 | #218 | Poor 74.5% |
| Nepalese | 10.5 /100 | #219 | Poor 74.5% |
| Immigrants | Norway | 10.3 /100 | #220 | Poor 74.5% |
| Chickasaw | 10.3 /100 | #221 | Poor 74.5% |
| Immigrants | India | 9.9 /100 | #222 | Tragic 74.4% |
| Hispanics or Latinos | 7.9 /100 | #223 | Tragic 74.4% |
| Seminole | 6.9 /100 | #224 | Tragic 74.3% |
| Ghanaians | 6.2 /100 | #225 | Tragic 74.3% |
| Immigrants | Fiji | 5.9 /100 | #226 | Tragic 74.3% |
| Immigrants | Ireland | 5.8 /100 | #227 | Tragic 74.3% |
| Immigrants | Ukraine | 5.1 /100 | #228 | Tragic 74.2% |
| Immigrants | Sweden | 4.6 /100 | #229 | Tragic 74.2% |
| Immigrants | Albania | 4.3 /100 | #230 | Tragic 74.2% |
| Immigrants | Greece | 4.1 /100 | #231 | Tragic 74.2% |
Demographics Similar to Austrians by In Labor Force | Age 20-24
In terms of in labor force | age 20-24, the demographic groups most similar to Austrians are Carpatho Rusyn (76.5%, a difference of 0.010%), Portuguese (76.4%, a difference of 0.030%), Immigrants from Iraq (76.4%, a difference of 0.050%), Immigrants from Thailand (76.4%, a difference of 0.050%), and Basque (76.5%, a difference of 0.10%).
| Demographics | Rating | Rank | In Labor Force | Age 20-24 |
| Immigrants | Cameroon | 99.6 /100 | #77 | Exceptional 76.6% |
| Canadians | 99.6 /100 | #78 | Exceptional 76.6% |
| Immigrants | Zaire | 99.6 /100 | #79 | Exceptional 76.6% |
| Italians | 99.6 /100 | #80 | Exceptional 76.5% |
| Basques | 99.5 /100 | #81 | Exceptional 76.5% |
| Hmong | 99.5 /100 | #82 | Exceptional 76.5% |
| Carpatho Rusyns | 99.4 /100 | #83 | Exceptional 76.5% |
| Austrians | 99.4 /100 | #84 | Exceptional 76.5% |
| Portuguese | 99.3 /100 | #85 | Exceptional 76.4% |
| Immigrants | Iraq | 99.3 /100 | #86 | Exceptional 76.4% |
| Immigrants | Thailand | 99.3 /100 | #87 | Exceptional 76.4% |
| Spanish | 99.2 /100 | #88 | Exceptional 76.4% |
| Bulgarians | 99.2 /100 | #89 | Exceptional 76.4% |
| Immigrants | Burma/Myanmar | 99.1 /100 | #90 | Exceptional 76.3% |
| Sierra Leoneans | 99.0 /100 | #91 | Exceptional 76.3% |