Yugoslavian vs Jordanian In Labor Force | Age 20-24
COMPARE
Yugoslavian
Jordanian
In Labor Force | Age 20-24
In Labor Force | Age 20-24 Comparison
Yugoslavians
Jordanians
78.0%
IN LABOR FORCE | AGE 20-24
100.0/ 100
METRIC RATING
23rd/ 347
METRIC RANK
75.5%
IN LABOR FORCE | AGE 20-24
84.8/ 100
METRIC RATING
137th/ 347
METRIC RANK
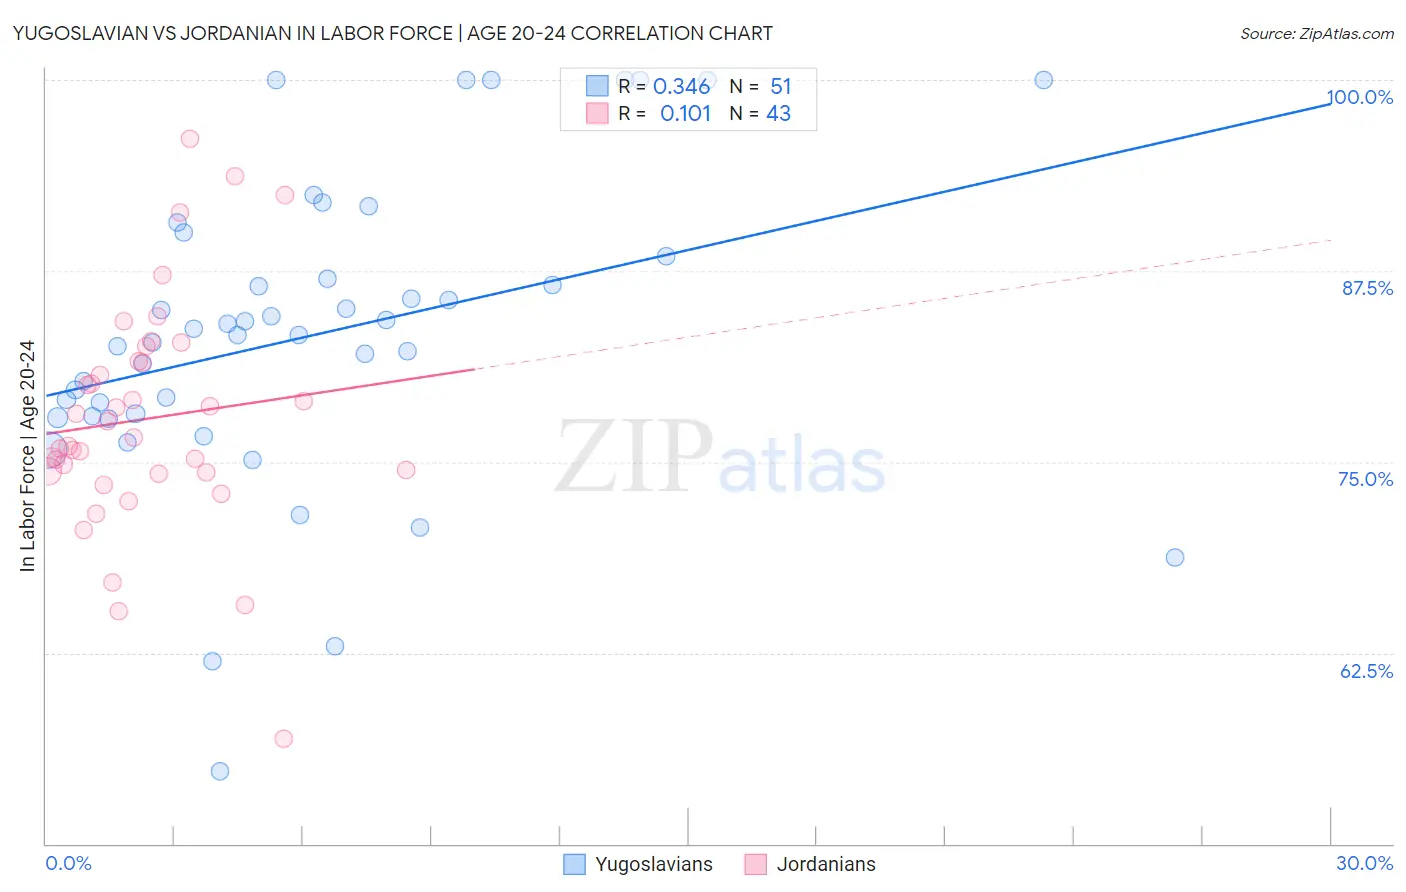
Yugoslavian vs Jordanian In Labor Force | Age 20-24 Correlation Chart
The statistical analysis conducted on geographies consisting of 285,583,037 people shows a mild positive correlation between the proportion of Yugoslavians and labor force participation rate among population between the ages 20 and 24 in the United States with a correlation coefficient (R) of 0.346 and weighted average of 78.0%. Similarly, the statistical analysis conducted on geographies consisting of 166,409,280 people shows a poor positive correlation between the proportion of Jordanians and labor force participation rate among population between the ages 20 and 24 in the United States with a correlation coefficient (R) of 0.101 and weighted average of 75.5%, a difference of 3.2%.
In Labor Force | Age 20-24 Correlation Summary
| Measurement | Yugoslavian | Jordanian |
| Minimum | 54.7% | 56.9% |
| Maximum | 100.0% | 96.2% |
| Range | 45.3% | 39.3% |
| Mean | 83.3% | 77.8% |
| Median | 83.3% | 76.6% |
| Interquartile 25% (IQ1) | 78.0% | 74.3% |
| Interquartile 75% (IQ3) | 88.5% | 81.6% |
| Interquartile Range (IQR) | 10.5% | 7.3% |
| Standard Deviation (Sample) | 10.0% | 7.6% |
| Standard Deviation (Population) | 9.9% | 7.5% |
Similar Demographics by In Labor Force | Age 20-24
Demographics Similar to Yugoslavians by In Labor Force | Age 20-24
In terms of in labor force | age 20-24, the demographic groups most similar to Yugoslavians are Liberian (78.0%, a difference of 0.0%), Pennsylvania German (78.0%, a difference of 0.010%), Tlingit-Haida (77.9%, a difference of 0.040%), Tongan (77.9%, a difference of 0.060%), and Puget Sound Salish (78.0%, a difference of 0.070%).
| Demographics | Rating | Rank | In Labor Force | Age 20-24 |
| Dutch | 100.0 /100 | #16 | Exceptional 78.4% |
| Cape Verdeans | 100.0 /100 | #17 | Exceptional 78.3% |
| Immigrants | Bosnia and Herzegovina | 100.0 /100 | #18 | Exceptional 78.1% |
| Bangladeshis | 100.0 /100 | #19 | Exceptional 78.1% |
| French Canadians | 100.0 /100 | #20 | Exceptional 78.1% |
| Puget Sound Salish | 100.0 /100 | #21 | Exceptional 78.0% |
| Pennsylvania Germans | 100.0 /100 | #22 | Exceptional 78.0% |
| Yugoslavians | 100.0 /100 | #23 | Exceptional 78.0% |
| Liberians | 100.0 /100 | #24 | Exceptional 78.0% |
| Tlingit-Haida | 100.0 /100 | #25 | Exceptional 77.9% |
| Tongans | 100.0 /100 | #26 | Exceptional 77.9% |
| Immigrants | Micronesia | 100.0 /100 | #27 | Exceptional 77.8% |
| Belgians | 100.0 /100 | #28 | Exceptional 77.8% |
| Slovaks | 100.0 /100 | #29 | Exceptional 77.7% |
| Swiss | 100.0 /100 | #30 | Exceptional 77.7% |
Demographics Similar to Jordanians by In Labor Force | Age 20-24
In terms of in labor force | age 20-24, the demographic groups most similar to Jordanians are Immigrants from Brazil (75.5%, a difference of 0.0%), Australian (75.5%, a difference of 0.0%), Immigrants from England (75.5%, a difference of 0.010%), Delaware (75.5%, a difference of 0.010%), and Yaqui (75.5%, a difference of 0.020%).
| Demographics | Rating | Rank | In Labor Force | Age 20-24 |
| Immigrants | Austria | 88.8 /100 | #130 | Excellent 75.6% |
| Immigrants | Jordan | 88.5 /100 | #131 | Excellent 75.6% |
| Palestinians | 88.4 /100 | #132 | Excellent 75.6% |
| Zimbabweans | 88.2 /100 | #133 | Excellent 75.6% |
| Estonians | 87.1 /100 | #134 | Excellent 75.6% |
| Yaqui | 85.5 /100 | #135 | Excellent 75.5% |
| Immigrants | Brazil | 84.8 /100 | #136 | Excellent 75.5% |
| Jordanians | 84.8 /100 | #137 | Excellent 75.5% |
| Australians | 84.8 /100 | #138 | Excellent 75.5% |
| Immigrants | England | 84.6 /100 | #139 | Excellent 75.5% |
| Delaware | 84.5 /100 | #140 | Excellent 75.5% |
| Romanians | 84.1 /100 | #141 | Excellent 75.5% |
| Blackfeet | 83.6 /100 | #142 | Excellent 75.5% |
| Spaniards | 82.0 /100 | #143 | Excellent 75.5% |
| Bhutanese | 80.8 /100 | #144 | Excellent 75.4% |