Seminole vs Immigrants from the Azores In Labor Force | Age 20-24
COMPARE
Seminole
Immigrants from the Azores
In Labor Force | Age 20-24
In Labor Force | Age 20-24 Comparison
Seminole
Immigrants from the Azores
74.3%
IN LABOR FORCE | AGE 20-24
6.9/ 100
METRIC RATING
224th/ 347
METRIC RANK
77.2%
IN LABOR FORCE | AGE 20-24
100.0/ 100
METRIC RATING
53rd/ 347
METRIC RANK
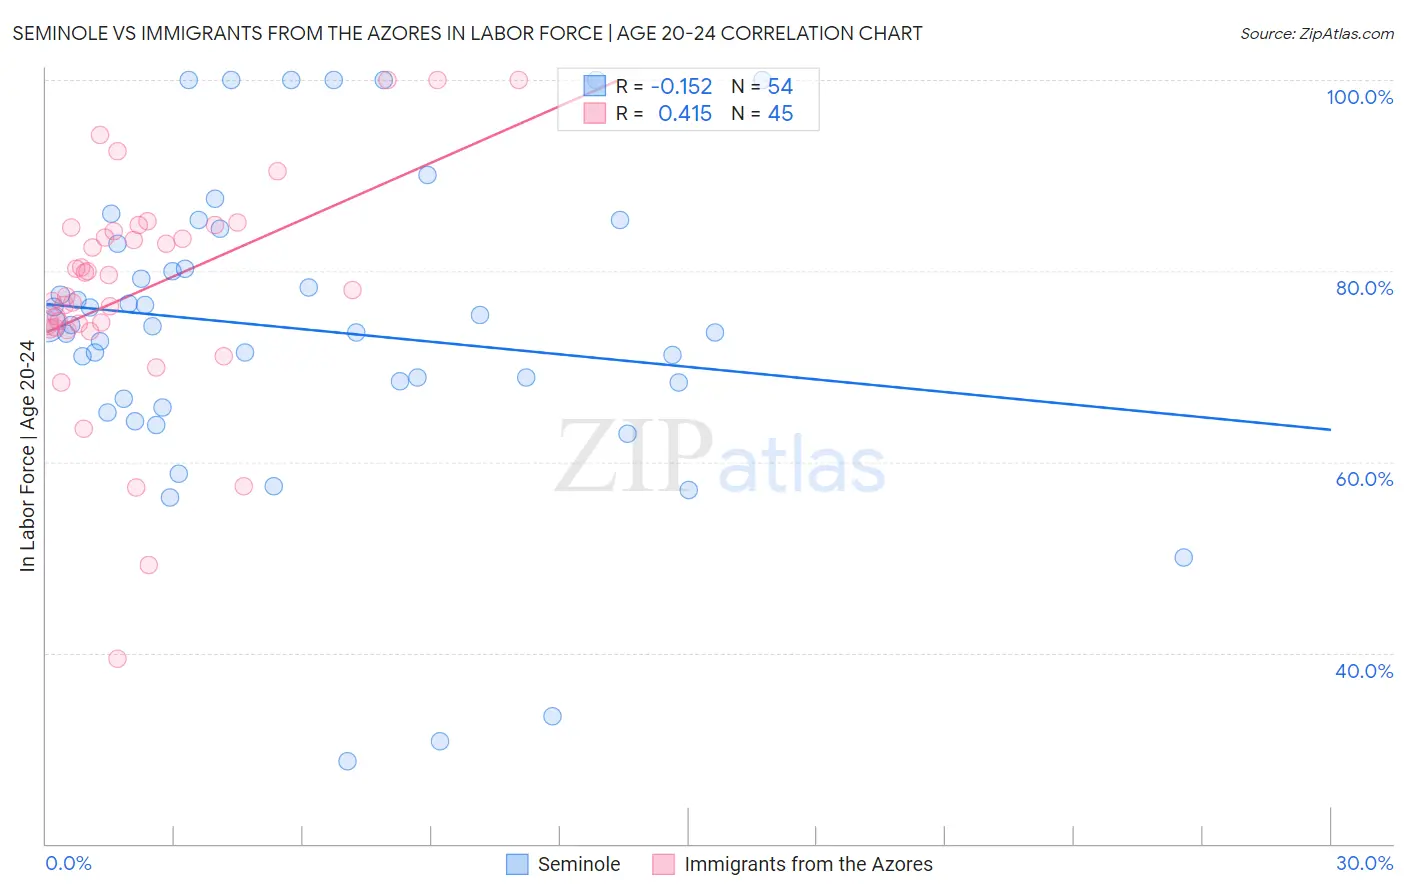
Seminole vs Immigrants from the Azores In Labor Force | Age 20-24 Correlation Chart
The statistical analysis conducted on geographies consisting of 118,300,066 people shows a poor negative correlation between the proportion of Seminole and labor force participation rate among population between the ages 20 and 24 in the United States with a correlation coefficient (R) of -0.152 and weighted average of 74.3%. Similarly, the statistical analysis conducted on geographies consisting of 46,250,012 people shows a moderate positive correlation between the proportion of Immigrants from the Azores and labor force participation rate among population between the ages 20 and 24 in the United States with a correlation coefficient (R) of 0.415 and weighted average of 77.2%, a difference of 3.9%.
In Labor Force | Age 20-24 Correlation Summary
| Measurement | Seminole | Immigrants from the Azores |
| Minimum | 28.6% | 39.3% |
| Maximum | 100.0% | 100.0% |
| Range | 71.4% | 60.7% |
| Mean | 73.9% | 78.0% |
| Median | 74.3% | 78.0% |
| Interquartile 25% (IQ1) | 66.6% | 74.0% |
| Interquartile 75% (IQ3) | 82.9% | 84.4% |
| Interquartile Range (IQR) | 16.3% | 10.4% |
| Standard Deviation (Sample) | 16.2% | 11.9% |
| Standard Deviation (Population) | 16.0% | 11.8% |
Similar Demographics by In Labor Force | Age 20-24
Demographics Similar to Seminole by In Labor Force | Age 20-24
In terms of in labor force | age 20-24, the demographic groups most similar to Seminole are Ghanaian (74.3%, a difference of 0.040%), Hispanic or Latino (74.4%, a difference of 0.060%), Immigrants from Fiji (74.3%, a difference of 0.060%), Immigrants from Ireland (74.3%, a difference of 0.070%), and Immigrants from Ukraine (74.2%, a difference of 0.12%).
| Demographics | Rating | Rank | In Labor Force | Age 20-24 |
| Chileans | 12.5 /100 | #217 | Poor 74.5% |
| Immigrants | Peru | 10.6 /100 | #218 | Poor 74.5% |
| Nepalese | 10.5 /100 | #219 | Poor 74.5% |
| Immigrants | Norway | 10.3 /100 | #220 | Poor 74.5% |
| Chickasaw | 10.3 /100 | #221 | Poor 74.5% |
| Immigrants | India | 9.9 /100 | #222 | Tragic 74.4% |
| Hispanics or Latinos | 7.9 /100 | #223 | Tragic 74.4% |
| Seminole | 6.9 /100 | #224 | Tragic 74.3% |
| Ghanaians | 6.2 /100 | #225 | Tragic 74.3% |
| Immigrants | Fiji | 5.9 /100 | #226 | Tragic 74.3% |
| Immigrants | Ireland | 5.8 /100 | #227 | Tragic 74.3% |
| Immigrants | Ukraine | 5.1 /100 | #228 | Tragic 74.2% |
| Immigrants | Sweden | 4.6 /100 | #229 | Tragic 74.2% |
| Immigrants | Albania | 4.3 /100 | #230 | Tragic 74.2% |
| Immigrants | Greece | 4.1 /100 | #231 | Tragic 74.2% |
Demographics Similar to Immigrants from the Azores by In Labor Force | Age 20-24
In terms of in labor force | age 20-24, the demographic groups most similar to Immigrants from the Azores are Indonesian (77.2%, a difference of 0.010%), Croatian (77.2%, a difference of 0.020%), Malaysian (77.2%, a difference of 0.030%), Chinese (77.3%, a difference of 0.070%), and Serbian (77.3%, a difference of 0.080%).
| Demographics | Rating | Rank | In Labor Force | Age 20-24 |
| Samoans | 100.0 /100 | #46 | Exceptional 77.4% |
| Ethiopians | 100.0 /100 | #47 | Exceptional 77.3% |
| Serbians | 100.0 /100 | #48 | Exceptional 77.3% |
| Chinese | 100.0 /100 | #49 | Exceptional 77.3% |
| Malaysians | 100.0 /100 | #50 | Exceptional 77.2% |
| Croatians | 100.0 /100 | #51 | Exceptional 77.2% |
| Indonesians | 100.0 /100 | #52 | Exceptional 77.2% |
| Immigrants | Azores | 100.0 /100 | #53 | Exceptional 77.2% |
| Celtics | 99.9 /100 | #54 | Exceptional 77.1% |
| Immigrants | Liberia | 99.9 /100 | #55 | Exceptional 77.1% |
| Europeans | 99.9 /100 | #56 | Exceptional 77.1% |
| Chippewa | 99.9 /100 | #57 | Exceptional 77.1% |
| Hawaiians | 99.9 /100 | #58 | Exceptional 77.0% |
| Scotch-Irish | 99.9 /100 | #59 | Exceptional 77.0% |
| Kenyans | 99.9 /100 | #60 | Exceptional 77.0% |