Scotch-Irish vs South African In Labor Force | Age 35-44
COMPARE
Scotch-Irish
South African
In Labor Force | Age 35-44
In Labor Force | Age 35-44 Comparison
Scotch-Irish
South Africans
83.5%
IN LABOR FORCE | AGE 35-44
0.1/ 100
METRIC RATING
264th/ 347
METRIC RANK
84.3%
IN LABOR FORCE | AGE 35-44
34.1/ 100
METRIC RATING
188th/ 347
METRIC RANK
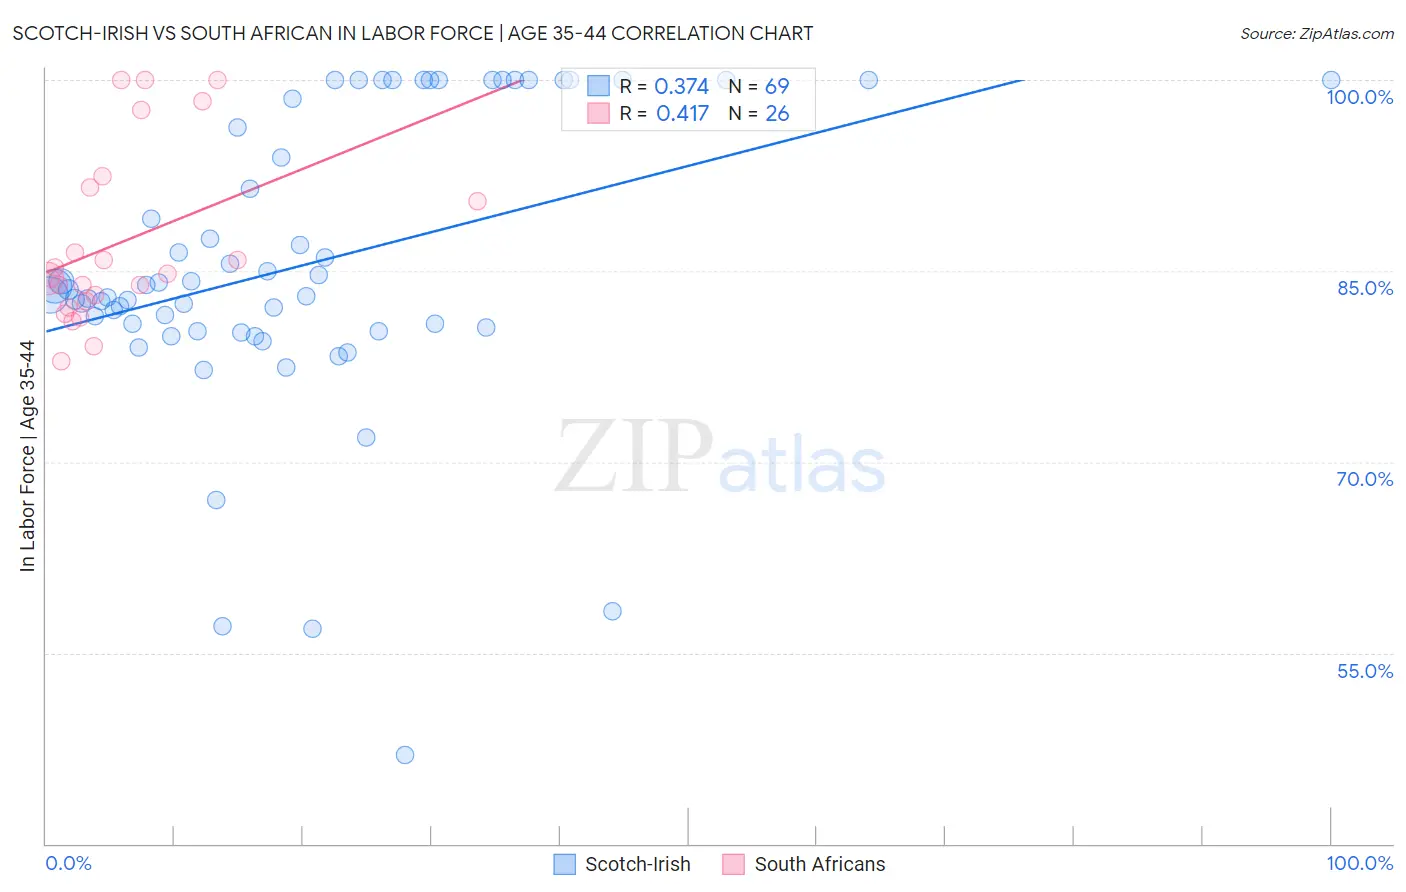
Scotch-Irish vs South African In Labor Force | Age 35-44 Correlation Chart
The statistical analysis conducted on geographies consisting of 548,325,894 people shows a mild positive correlation between the proportion of Scotch-Irish and labor force participation rate among population between the ages 35 and 44 in the United States with a correlation coefficient (R) of 0.374 and weighted average of 83.5%. Similarly, the statistical analysis conducted on geographies consisting of 182,546,351 people shows a moderate positive correlation between the proportion of South Africans and labor force participation rate among population between the ages 35 and 44 in the United States with a correlation coefficient (R) of 0.417 and weighted average of 84.3%, a difference of 0.98%.
In Labor Force | Age 35-44 Correlation Summary
| Measurement | Scotch-Irish | South African |
| Minimum | 47.0% | 77.9% |
| Maximum | 100.0% | 100.0% |
| Range | 53.0% | 22.1% |
| Mean | 85.5% | 87.2% |
| Median | 83.5% | 84.6% |
| Interquartile 25% (IQ1) | 80.4% | 82.6% |
| Interquartile 75% (IQ3) | 99.3% | 91.5% |
| Interquartile Range (IQR) | 18.8% | 8.9% |
| Standard Deviation (Sample) | 11.5% | 6.8% |
| Standard Deviation (Population) | 11.4% | 6.7% |
Similar Demographics by In Labor Force | Age 35-44
Demographics Similar to Scotch-Irish by In Labor Force | Age 35-44
In terms of in labor force | age 35-44, the demographic groups most similar to Scotch-Irish are Central American (83.5%, a difference of 0.010%), Iroquois (83.5%, a difference of 0.030%), Spaniard (83.4%, a difference of 0.040%), Immigrants from Congo (83.5%, a difference of 0.060%), and Vietnamese (83.5%, a difference of 0.070%).
| Demographics | Rating | Rank | In Labor Force | Age 35-44 |
| Basques | 0.3 /100 | #257 | Tragic 83.6% |
| Tsimshian | 0.2 /100 | #258 | Tragic 83.5% |
| Immigrants | El Salvador | 0.2 /100 | #259 | Tragic 83.5% |
| Vietnamese | 0.2 /100 | #260 | Tragic 83.5% |
| Immigrants | Dominica | 0.2 /100 | #261 | Tragic 83.5% |
| Immigrants | Congo | 0.2 /100 | #262 | Tragic 83.5% |
| Iroquois | 0.2 /100 | #263 | Tragic 83.5% |
| Scotch-Irish | 0.1 /100 | #264 | Tragic 83.5% |
| Central Americans | 0.1 /100 | #265 | Tragic 83.5% |
| Spaniards | 0.1 /100 | #266 | Tragic 83.4% |
| Guamanians/Chamorros | 0.1 /100 | #267 | Tragic 83.4% |
| Hondurans | 0.1 /100 | #268 | Tragic 83.4% |
| Immigrants | Grenada | 0.1 /100 | #269 | Tragic 83.3% |
| Immigrants | Honduras | 0.0 /100 | #270 | Tragic 83.3% |
| French American Indians | 0.0 /100 | #271 | Tragic 83.2% |
Demographics Similar to South Africans by In Labor Force | Age 35-44
In terms of in labor force | age 35-44, the demographic groups most similar to South Africans are Immigrants from Denmark (84.3%, a difference of 0.0%), Armenian (84.3%, a difference of 0.010%), Costa Rican (84.3%, a difference of 0.010%), Australian (84.3%, a difference of 0.010%), and Dutch (84.3%, a difference of 0.010%).
| Demographics | Rating | Rank | In Labor Force | Age 35-44 |
| Immigrants | West Indies | 36.4 /100 | #181 | Fair 84.3% |
| Koreans | 36.3 /100 | #182 | Fair 84.3% |
| Barbadians | 36.2 /100 | #183 | Fair 84.3% |
| Armenians | 35.6 /100 | #184 | Fair 84.3% |
| Costa Ricans | 35.3 /100 | #185 | Fair 84.3% |
| Australians | 35.1 /100 | #186 | Fair 84.3% |
| Dutch | 34.8 /100 | #187 | Fair 84.3% |
| South Africans | 34.1 /100 | #188 | Fair 84.3% |
| Immigrants | Denmark | 33.7 /100 | #189 | Fair 84.3% |
| Portuguese | 31.9 /100 | #190 | Fair 84.3% |
| Immigrants | Philippines | 27.9 /100 | #191 | Fair 84.2% |
| Immigrants | Vietnam | 27.4 /100 | #192 | Fair 84.2% |
| Hungarians | 26.8 /100 | #193 | Fair 84.2% |
| Immigrants | Indonesia | 25.7 /100 | #194 | Fair 84.2% |
| Immigrants | Caribbean | 25.7 /100 | #195 | Fair 84.2% |