Korean vs South African In Labor Force | Age 35-44
COMPARE
Korean
South African
In Labor Force | Age 35-44
In Labor Force | Age 35-44 Comparison
Koreans
South Africans
84.3%
IN LABOR FORCE | AGE 35-44
36.3/ 100
METRIC RATING
182nd/ 347
METRIC RANK
84.3%
IN LABOR FORCE | AGE 35-44
34.1/ 100
METRIC RATING
188th/ 347
METRIC RANK
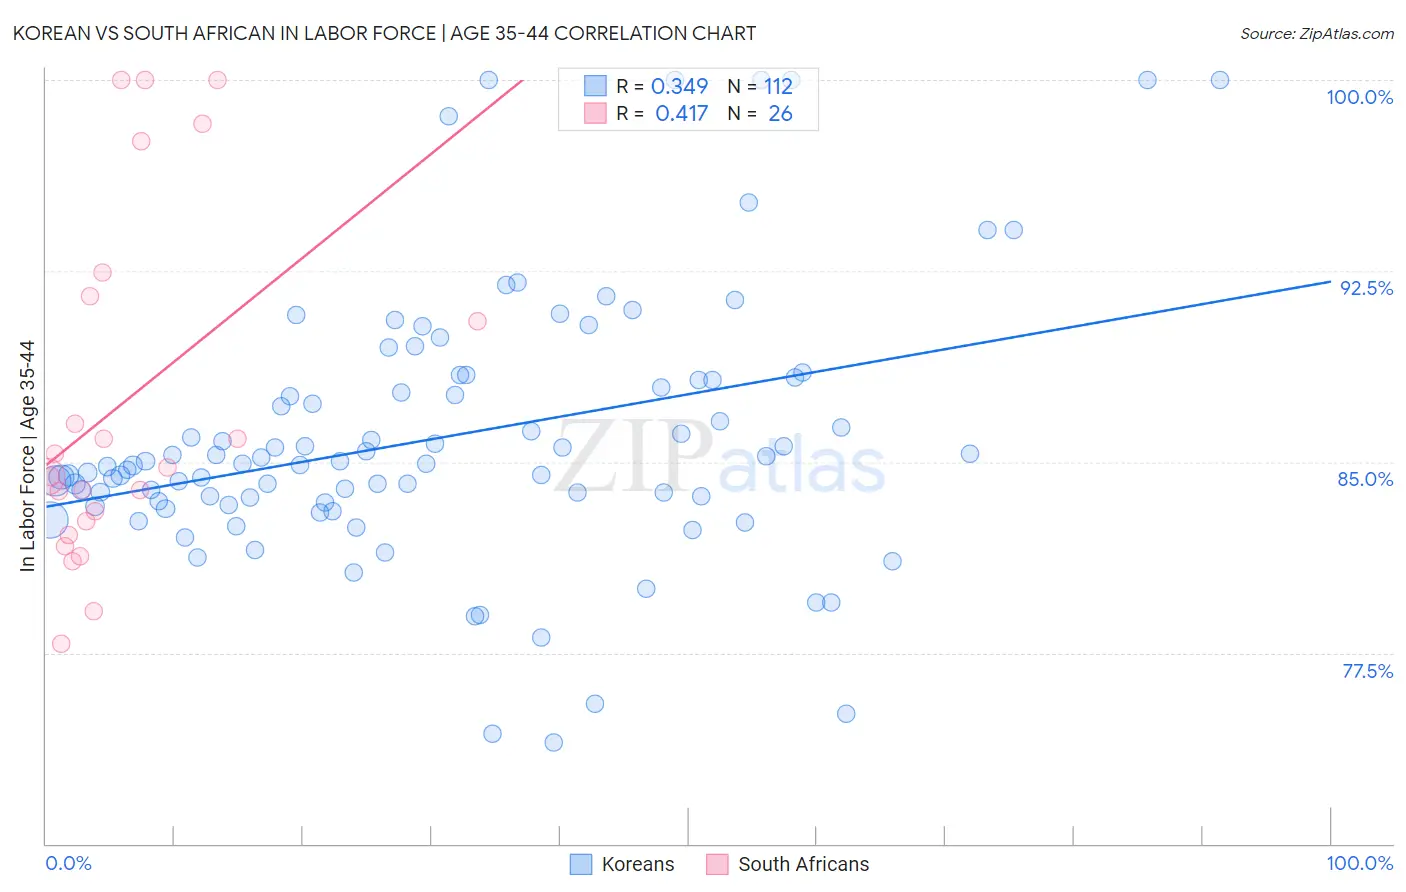
Korean vs South African In Labor Force | Age 35-44 Correlation Chart
The statistical analysis conducted on geographies consisting of 510,522,500 people shows a mild positive correlation between the proportion of Koreans and labor force participation rate among population between the ages 35 and 44 in the United States with a correlation coefficient (R) of 0.349 and weighted average of 84.3%. Similarly, the statistical analysis conducted on geographies consisting of 182,546,351 people shows a moderate positive correlation between the proportion of South Africans and labor force participation rate among population between the ages 35 and 44 in the United States with a correlation coefficient (R) of 0.417 and weighted average of 84.3%, a difference of 0.020%.
In Labor Force | Age 35-44 Correlation Summary
| Measurement | Korean | South African |
| Minimum | 74.0% | 77.9% |
| Maximum | 100.0% | 100.0% |
| Range | 26.0% | 22.1% |
| Mean | 86.0% | 87.2% |
| Median | 84.9% | 84.6% |
| Interquartile 25% (IQ1) | 83.4% | 82.6% |
| Interquartile 75% (IQ3) | 88.2% | 91.5% |
| Interquartile Range (IQR) | 4.8% | 8.9% |
| Standard Deviation (Sample) | 5.2% | 6.8% |
| Standard Deviation (Population) | 5.2% | 6.7% |
Demographics Similar to Koreans and South Africans by In Labor Force | Age 35-44
In terms of in labor force | age 35-44, the demographic groups most similar to Koreans are Immigrants from West Indies (84.3%, a difference of 0.0%), Barbadian (84.3%, a difference of 0.0%), Armenian (84.3%, a difference of 0.010%), Costa Rican (84.3%, a difference of 0.010%), and Australian (84.3%, a difference of 0.010%). Similarly, the demographic groups most similar to South Africans are Immigrants from Denmark (84.3%, a difference of 0.0%), Armenian (84.3%, a difference of 0.010%), Costa Rican (84.3%, a difference of 0.010%), Australian (84.3%, a difference of 0.010%), and Dutch (84.3%, a difference of 0.010%).
| Demographics | Rating | Rank | In Labor Force | Age 35-44 |
| Pakistanis | 48.2 /100 | #175 | Average 84.4% |
| Sri Lankans | 47.3 /100 | #176 | Average 84.4% |
| French Canadians | 44.3 /100 | #177 | Average 84.3% |
| Northern Europeans | 44.1 /100 | #178 | Average 84.3% |
| Immigrants | South Africa | 42.8 /100 | #179 | Average 84.3% |
| Danes | 38.8 /100 | #180 | Fair 84.3% |
| Immigrants | West Indies | 36.4 /100 | #181 | Fair 84.3% |
| Koreans | 36.3 /100 | #182 | Fair 84.3% |
| Barbadians | 36.2 /100 | #183 | Fair 84.3% |
| Armenians | 35.6 /100 | #184 | Fair 84.3% |
| Costa Ricans | 35.3 /100 | #185 | Fair 84.3% |
| Australians | 35.1 /100 | #186 | Fair 84.3% |
| Dutch | 34.8 /100 | #187 | Fair 84.3% |
| South Africans | 34.1 /100 | #188 | Fair 84.3% |
| Immigrants | Denmark | 33.7 /100 | #189 | Fair 84.3% |
| Portuguese | 31.9 /100 | #190 | Fair 84.3% |
| Immigrants | Philippines | 27.9 /100 | #191 | Fair 84.2% |
| Immigrants | Vietnam | 27.4 /100 | #192 | Fair 84.2% |
| Hungarians | 26.8 /100 | #193 | Fair 84.2% |
| Immigrants | Indonesia | 25.7 /100 | #194 | Fair 84.2% |
| Immigrants | Caribbean | 25.7 /100 | #195 | Fair 84.2% |