Immigrants from Zimbabwe vs South African In Labor Force | Age 35-44
COMPARE
Immigrants from Zimbabwe
South African
In Labor Force | Age 35-44
In Labor Force | Age 35-44 Comparison
Immigrants from Zimbabwe
South Africans
85.2%
IN LABOR FORCE | AGE 35-44
99.8/ 100
METRIC RATING
41st/ 347
METRIC RANK
84.3%
IN LABOR FORCE | AGE 35-44
34.1/ 100
METRIC RATING
188th/ 347
METRIC RANK
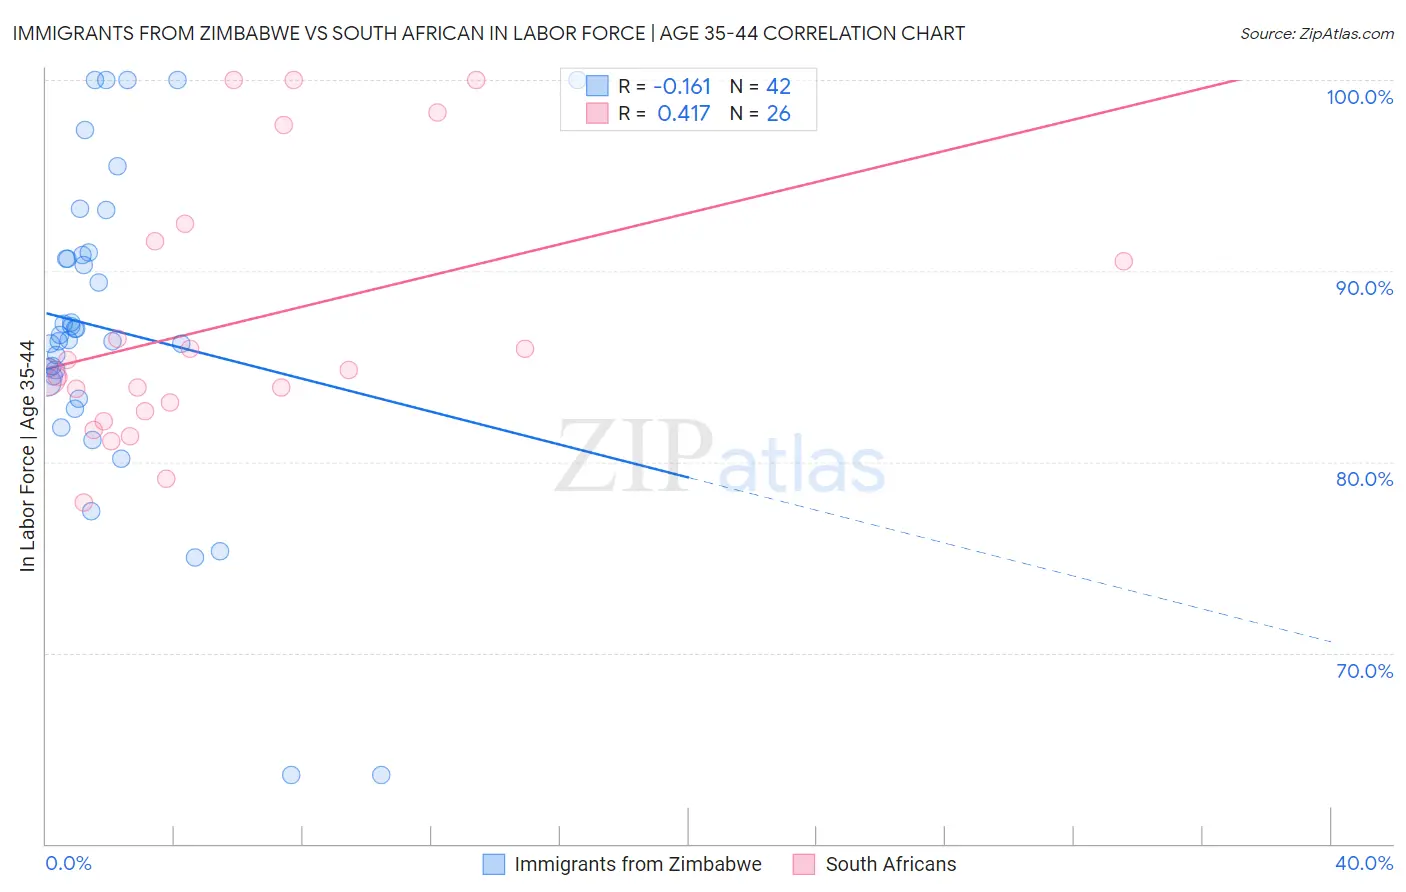
Immigrants from Zimbabwe vs South African In Labor Force | Age 35-44 Correlation Chart
The statistical analysis conducted on geographies consisting of 117,794,320 people shows a poor negative correlation between the proportion of Immigrants from Zimbabwe and labor force participation rate among population between the ages 35 and 44 in the United States with a correlation coefficient (R) of -0.161 and weighted average of 85.2%. Similarly, the statistical analysis conducted on geographies consisting of 182,546,351 people shows a moderate positive correlation between the proportion of South Africans and labor force participation rate among population between the ages 35 and 44 in the United States with a correlation coefficient (R) of 0.417 and weighted average of 84.3%, a difference of 1.1%.
In Labor Force | Age 35-44 Correlation Summary
| Measurement | Immigrants from Zimbabwe | South African |
| Minimum | 63.6% | 77.9% |
| Maximum | 100.0% | 100.0% |
| Range | 36.4% | 22.1% |
| Mean | 86.9% | 87.2% |
| Median | 86.5% | 84.6% |
| Interquartile 25% (IQ1) | 84.1% | 82.6% |
| Interquartile 75% (IQ3) | 90.8% | 91.5% |
| Interquartile Range (IQR) | 6.7% | 8.9% |
| Standard Deviation (Sample) | 8.3% | 6.8% |
| Standard Deviation (Population) | 8.2% | 6.7% |
Similar Demographics by In Labor Force | Age 35-44
Demographics Similar to Immigrants from Zimbabwe by In Labor Force | Age 35-44
In terms of in labor force | age 35-44, the demographic groups most similar to Immigrants from Zimbabwe are Immigrants from Bulgaria (85.2%, a difference of 0.0%), Macedonian (85.2%, a difference of 0.0%), Immigrants from Poland (85.2%, a difference of 0.010%), Eastern European (85.2%, a difference of 0.010%), and Polish (85.2%, a difference of 0.010%).
| Demographics | Rating | Rank | In Labor Force | Age 35-44 |
| Immigrants | Nepal | 99.9 /100 | #34 | Exceptional 85.3% |
| Estonians | 99.9 /100 | #35 | Exceptional 85.3% |
| Immigrants | Morocco | 99.8 /100 | #36 | Exceptional 85.2% |
| Kenyans | 99.8 /100 | #37 | Exceptional 85.2% |
| Immigrants | Poland | 99.8 /100 | #38 | Exceptional 85.2% |
| Eastern Europeans | 99.8 /100 | #39 | Exceptional 85.2% |
| Immigrants | Bulgaria | 99.8 /100 | #40 | Exceptional 85.2% |
| Immigrants | Zimbabwe | 99.8 /100 | #41 | Exceptional 85.2% |
| Macedonians | 99.8 /100 | #42 | Exceptional 85.2% |
| Poles | 99.8 /100 | #43 | Exceptional 85.2% |
| Lithuanians | 99.8 /100 | #44 | Exceptional 85.2% |
| Cypriots | 99.8 /100 | #45 | Exceptional 85.2% |
| Immigrants | Hong Kong | 99.8 /100 | #46 | Exceptional 85.2% |
| German Russians | 99.8 /100 | #47 | Exceptional 85.2% |
| Immigrants | Eritrea | 99.7 /100 | #48 | Exceptional 85.2% |
Demographics Similar to South Africans by In Labor Force | Age 35-44
In terms of in labor force | age 35-44, the demographic groups most similar to South Africans are Immigrants from Denmark (84.3%, a difference of 0.0%), Armenian (84.3%, a difference of 0.010%), Costa Rican (84.3%, a difference of 0.010%), Australian (84.3%, a difference of 0.010%), and Dutch (84.3%, a difference of 0.010%).
| Demographics | Rating | Rank | In Labor Force | Age 35-44 |
| Immigrants | West Indies | 36.4 /100 | #181 | Fair 84.3% |
| Koreans | 36.3 /100 | #182 | Fair 84.3% |
| Barbadians | 36.2 /100 | #183 | Fair 84.3% |
| Armenians | 35.6 /100 | #184 | Fair 84.3% |
| Costa Ricans | 35.3 /100 | #185 | Fair 84.3% |
| Australians | 35.1 /100 | #186 | Fair 84.3% |
| Dutch | 34.8 /100 | #187 | Fair 84.3% |
| South Africans | 34.1 /100 | #188 | Fair 84.3% |
| Immigrants | Denmark | 33.7 /100 | #189 | Fair 84.3% |
| Portuguese | 31.9 /100 | #190 | Fair 84.3% |
| Immigrants | Philippines | 27.9 /100 | #191 | Fair 84.2% |
| Immigrants | Vietnam | 27.4 /100 | #192 | Fair 84.2% |
| Hungarians | 26.8 /100 | #193 | Fair 84.2% |
| Immigrants | Indonesia | 25.7 /100 | #194 | Fair 84.2% |
| Immigrants | Caribbean | 25.7 /100 | #195 | Fair 84.2% |