Puerto Rican vs South African In Labor Force | Age 35-44
COMPARE
Puerto Rican
South African
In Labor Force | Age 35-44
In Labor Force | Age 35-44 Comparison
Puerto Ricans
South Africans
80.7%
IN LABOR FORCE | AGE 35-44
0.0/ 100
METRIC RATING
321st/ 347
METRIC RANK
84.3%
IN LABOR FORCE | AGE 35-44
34.1/ 100
METRIC RATING
188th/ 347
METRIC RANK
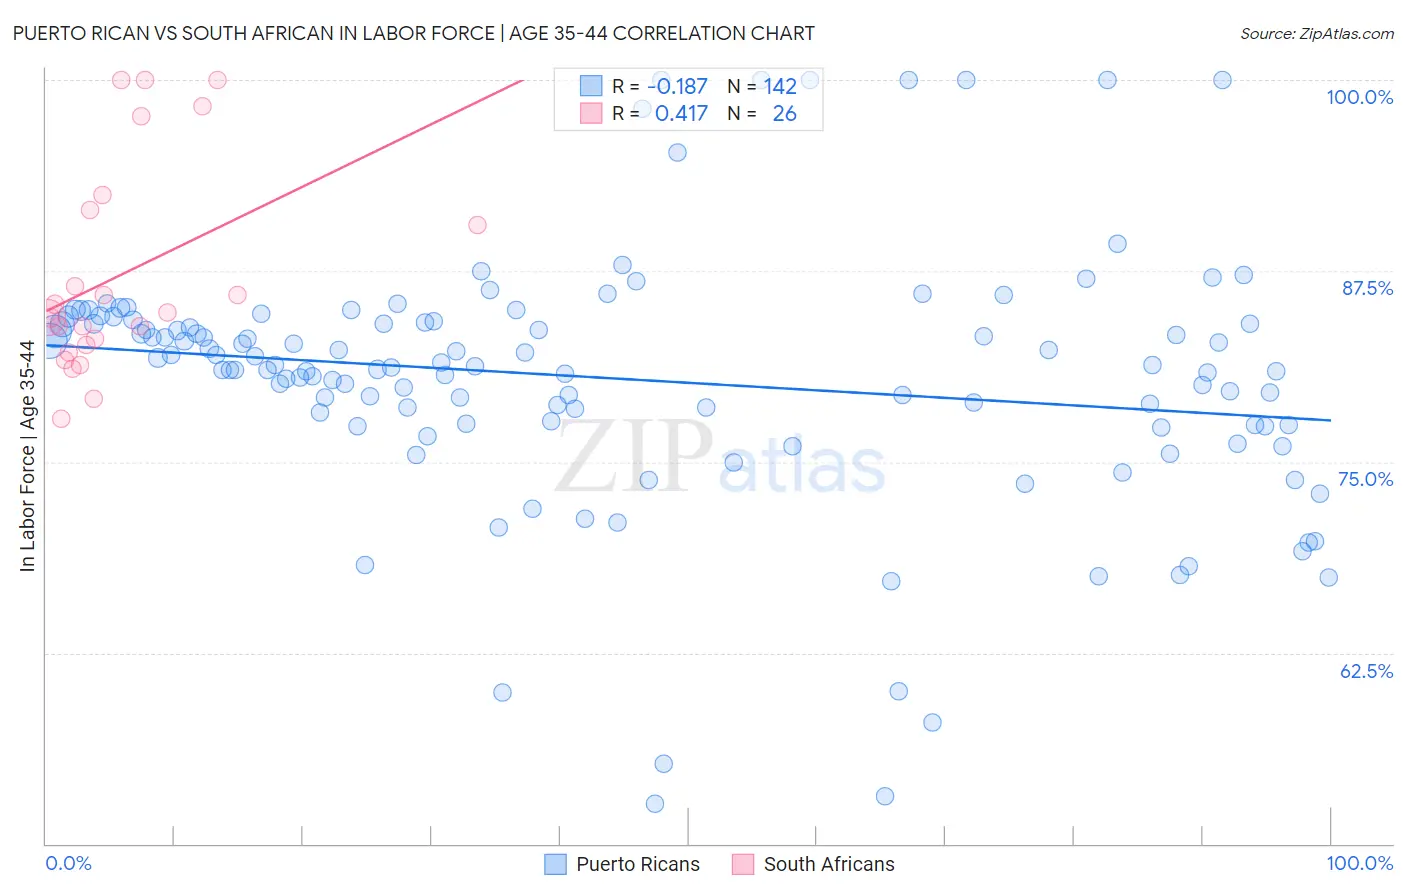
Puerto Rican vs South African In Labor Force | Age 35-44 Correlation Chart
The statistical analysis conducted on geographies consisting of 527,777,959 people shows a poor negative correlation between the proportion of Puerto Ricans and labor force participation rate among population between the ages 35 and 44 in the United States with a correlation coefficient (R) of -0.187 and weighted average of 80.7%. Similarly, the statistical analysis conducted on geographies consisting of 182,546,351 people shows a moderate positive correlation between the proportion of South Africans and labor force participation rate among population between the ages 35 and 44 in the United States with a correlation coefficient (R) of 0.417 and weighted average of 84.3%, a difference of 4.4%.
In Labor Force | Age 35-44 Correlation Summary
| Measurement | Puerto Rican | South African |
| Minimum | 52.6% | 77.9% |
| Maximum | 100.0% | 100.0% |
| Range | 47.4% | 22.1% |
| Mean | 80.4% | 87.2% |
| Median | 81.2% | 84.6% |
| Interquartile 25% (IQ1) | 77.5% | 82.6% |
| Interquartile 75% (IQ3) | 84.1% | 91.5% |
| Interquartile Range (IQR) | 6.7% | 8.9% |
| Standard Deviation (Sample) | 8.4% | 6.8% |
| Standard Deviation (Population) | 8.3% | 6.7% |
Similar Demographics by In Labor Force | Age 35-44
Demographics Similar to Puerto Ricans by In Labor Force | Age 35-44
In terms of in labor force | age 35-44, the demographic groups most similar to Puerto Ricans are Paiute (80.6%, a difference of 0.070%), Yaqui (80.5%, a difference of 0.18%), Choctaw (80.5%, a difference of 0.19%), Chickasaw (80.9%, a difference of 0.28%), and Inupiat (80.9%, a difference of 0.33%).
| Demographics | Rating | Rank | In Labor Force | Age 35-44 |
| Cajuns | 0.0 /100 | #314 | Tragic 81.5% |
| Immigrants | Mexico | 0.0 /100 | #315 | Tragic 81.5% |
| Comanche | 0.0 /100 | #316 | Tragic 81.5% |
| Cherokee | 0.0 /100 | #317 | Tragic 81.4% |
| Alaskan Athabascans | 0.0 /100 | #318 | Tragic 81.3% |
| Inupiat | 0.0 /100 | #319 | Tragic 80.9% |
| Chickasaw | 0.0 /100 | #320 | Tragic 80.9% |
| Puerto Ricans | 0.0 /100 | #321 | Tragic 80.7% |
| Paiute | 0.0 /100 | #322 | Tragic 80.6% |
| Yaqui | 0.0 /100 | #323 | Tragic 80.5% |
| Choctaw | 0.0 /100 | #324 | Tragic 80.5% |
| Dutch West Indians | 0.0 /100 | #325 | Tragic 80.4% |
| Seminole | 0.0 /100 | #326 | Tragic 80.4% |
| Sioux | 0.0 /100 | #327 | Tragic 80.2% |
| Creek | 0.0 /100 | #328 | Tragic 80.0% |
Demographics Similar to South Africans by In Labor Force | Age 35-44
In terms of in labor force | age 35-44, the demographic groups most similar to South Africans are Immigrants from Denmark (84.3%, a difference of 0.0%), Armenian (84.3%, a difference of 0.010%), Costa Rican (84.3%, a difference of 0.010%), Australian (84.3%, a difference of 0.010%), and Dutch (84.3%, a difference of 0.010%).
| Demographics | Rating | Rank | In Labor Force | Age 35-44 |
| Immigrants | West Indies | 36.4 /100 | #181 | Fair 84.3% |
| Koreans | 36.3 /100 | #182 | Fair 84.3% |
| Barbadians | 36.2 /100 | #183 | Fair 84.3% |
| Armenians | 35.6 /100 | #184 | Fair 84.3% |
| Costa Ricans | 35.3 /100 | #185 | Fair 84.3% |
| Australians | 35.1 /100 | #186 | Fair 84.3% |
| Dutch | 34.8 /100 | #187 | Fair 84.3% |
| South Africans | 34.1 /100 | #188 | Fair 84.3% |
| Immigrants | Denmark | 33.7 /100 | #189 | Fair 84.3% |
| Portuguese | 31.9 /100 | #190 | Fair 84.3% |
| Immigrants | Philippines | 27.9 /100 | #191 | Fair 84.2% |
| Immigrants | Vietnam | 27.4 /100 | #192 | Fair 84.2% |
| Hungarians | 26.8 /100 | #193 | Fair 84.2% |
| Immigrants | Indonesia | 25.7 /100 | #194 | Fair 84.2% |
| Immigrants | Caribbean | 25.7 /100 | #195 | Fair 84.2% |