Scotch-Irish vs Immigrants from Peru In Labor Force | Age 35-44
COMPARE
Scotch-Irish
Immigrants from Peru
In Labor Force | Age 35-44
In Labor Force | Age 35-44 Comparison
Scotch-Irish
Immigrants from Peru
83.5%
IN LABOR FORCE | AGE 35-44
0.1/ 100
METRIC RATING
264th/ 347
METRIC RANK
84.9%
IN LABOR FORCE | AGE 35-44
97.8/ 100
METRIC RATING
84th/ 347
METRIC RANK
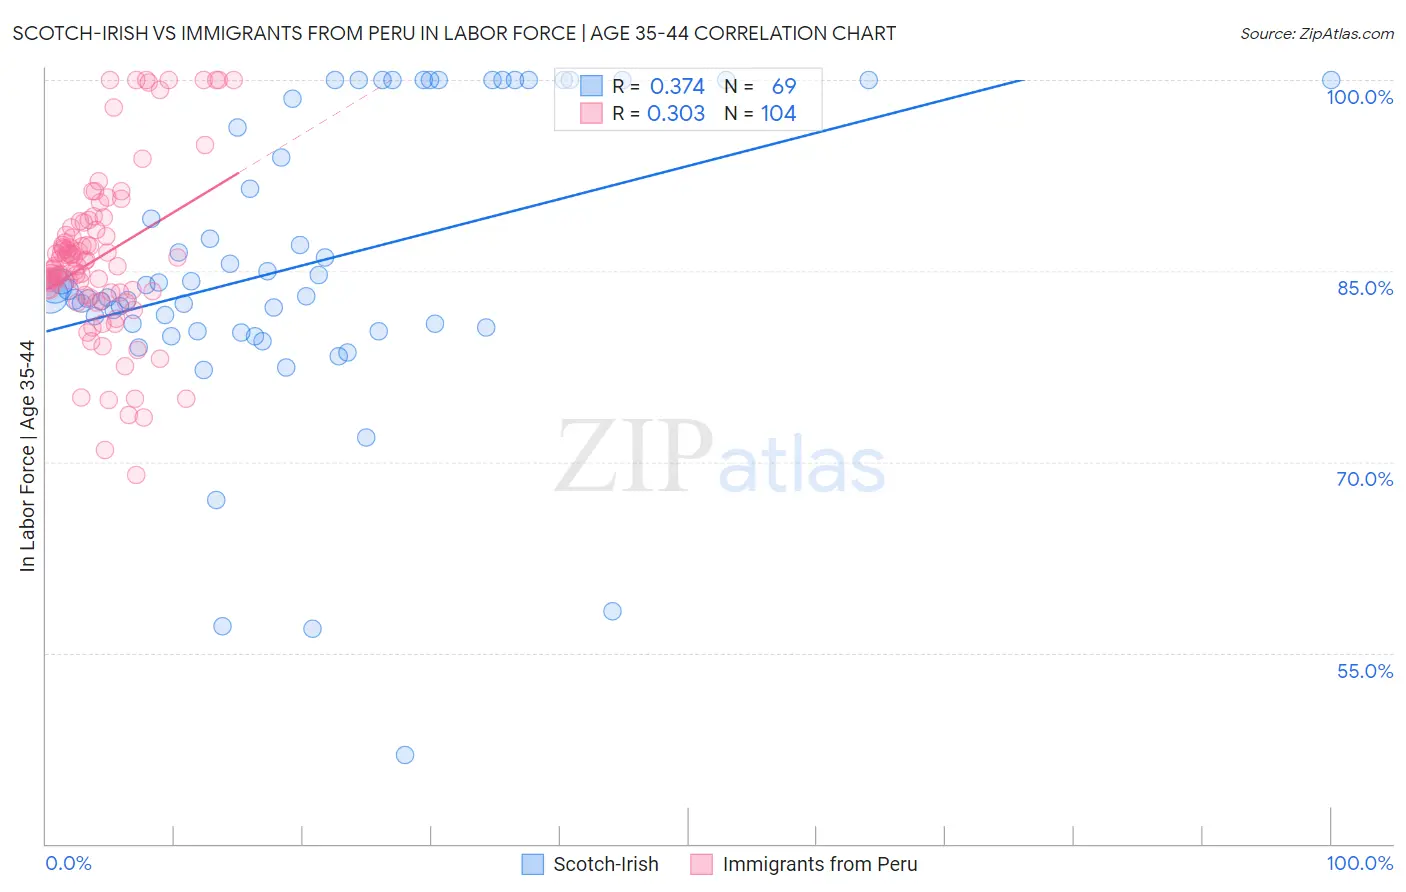
Scotch-Irish vs Immigrants from Peru In Labor Force | Age 35-44 Correlation Chart
The statistical analysis conducted on geographies consisting of 548,325,894 people shows a mild positive correlation between the proportion of Scotch-Irish and labor force participation rate among population between the ages 35 and 44 in the United States with a correlation coefficient (R) of 0.374 and weighted average of 83.5%. Similarly, the statistical analysis conducted on geographies consisting of 328,794,059 people shows a mild positive correlation between the proportion of Immigrants from Peru and labor force participation rate among population between the ages 35 and 44 in the United States with a correlation coefficient (R) of 0.303 and weighted average of 84.9%, a difference of 1.7%.
In Labor Force | Age 35-44 Correlation Summary
| Measurement | Scotch-Irish | Immigrants from Peru |
| Minimum | 47.0% | 69.0% |
| Maximum | 100.0% | 100.0% |
| Range | 53.0% | 31.0% |
| Mean | 85.5% | 86.1% |
| Median | 83.5% | 85.6% |
| Interquartile 25% (IQ1) | 80.4% | 83.3% |
| Interquartile 75% (IQ3) | 99.3% | 88.3% |
| Interquartile Range (IQR) | 18.8% | 5.0% |
| Standard Deviation (Sample) | 11.5% | 6.5% |
| Standard Deviation (Population) | 11.4% | 6.5% |
Similar Demographics by In Labor Force | Age 35-44
Demographics Similar to Scotch-Irish by In Labor Force | Age 35-44
In terms of in labor force | age 35-44, the demographic groups most similar to Scotch-Irish are Central American (83.5%, a difference of 0.010%), Iroquois (83.5%, a difference of 0.030%), Spaniard (83.4%, a difference of 0.040%), Immigrants from Congo (83.5%, a difference of 0.060%), and Vietnamese (83.5%, a difference of 0.070%).
| Demographics | Rating | Rank | In Labor Force | Age 35-44 |
| Basques | 0.3 /100 | #257 | Tragic 83.6% |
| Tsimshian | 0.2 /100 | #258 | Tragic 83.5% |
| Immigrants | El Salvador | 0.2 /100 | #259 | Tragic 83.5% |
| Vietnamese | 0.2 /100 | #260 | Tragic 83.5% |
| Immigrants | Dominica | 0.2 /100 | #261 | Tragic 83.5% |
| Immigrants | Congo | 0.2 /100 | #262 | Tragic 83.5% |
| Iroquois | 0.2 /100 | #263 | Tragic 83.5% |
| Scotch-Irish | 0.1 /100 | #264 | Tragic 83.5% |
| Central Americans | 0.1 /100 | #265 | Tragic 83.5% |
| Spaniards | 0.1 /100 | #266 | Tragic 83.4% |
| Guamanians/Chamorros | 0.1 /100 | #267 | Tragic 83.4% |
| Hondurans | 0.1 /100 | #268 | Tragic 83.4% |
| Immigrants | Grenada | 0.1 /100 | #269 | Tragic 83.3% |
| Immigrants | Honduras | 0.0 /100 | #270 | Tragic 83.3% |
| French American Indians | 0.0 /100 | #271 | Tragic 83.2% |
Demographics Similar to Immigrants from Peru by In Labor Force | Age 35-44
In terms of in labor force | age 35-44, the demographic groups most similar to Immigrants from Peru are Senegalese (84.9%, a difference of 0.0%), Immigrants from Middle Africa (84.9%, a difference of 0.0%), Greek (84.9%, a difference of 0.0%), Belgian (84.9%, a difference of 0.010%), and Yugoslavian (84.9%, a difference of 0.010%).
| Demographics | Rating | Rank | In Labor Force | Age 35-44 |
| Immigrants | Turkey | 98.6 /100 | #77 | Exceptional 84.9% |
| Immigrants | Africa | 98.4 /100 | #78 | Exceptional 84.9% |
| Peruvians | 98.3 /100 | #79 | Exceptional 84.9% |
| Immigrants | Colombia | 98.3 /100 | #80 | Exceptional 84.9% |
| Immigrants | Eastern Europe | 98.3 /100 | #81 | Exceptional 84.9% |
| Immigrants | Sudan | 98.1 /100 | #82 | Exceptional 84.9% |
| Senegalese | 97.8 /100 | #83 | Exceptional 84.9% |
| Immigrants | Peru | 97.8 /100 | #84 | Exceptional 84.9% |
| Immigrants | Middle Africa | 97.8 /100 | #85 | Exceptional 84.9% |
| Greeks | 97.8 /100 | #86 | Exceptional 84.9% |
| Belgians | 97.7 /100 | #87 | Exceptional 84.9% |
| Yugoslavians | 97.7 /100 | #88 | Exceptional 84.9% |
| Immigrants | Pakistan | 97.5 /100 | #89 | Exceptional 84.9% |
| Immigrants | France | 97.4 /100 | #90 | Exceptional 84.9% |
| Immigrants | Europe | 97.2 /100 | #91 | Exceptional 84.9% |