Basque vs Slovak In Labor Force | Age > 16
COMPARE
Basque
Slovak
In Labor Force | Age > 16
In Labor Force | Age > 16 Comparison
Basques
Slovaks
64.2%
IN LABOR FORCE | AGE > 16
0.7/ 100
METRIC RATING
261st/ 347
METRIC RANK
63.9%
IN LABOR FORCE | AGE > 16
0.1/ 100
METRIC RATING
285th/ 347
METRIC RANK
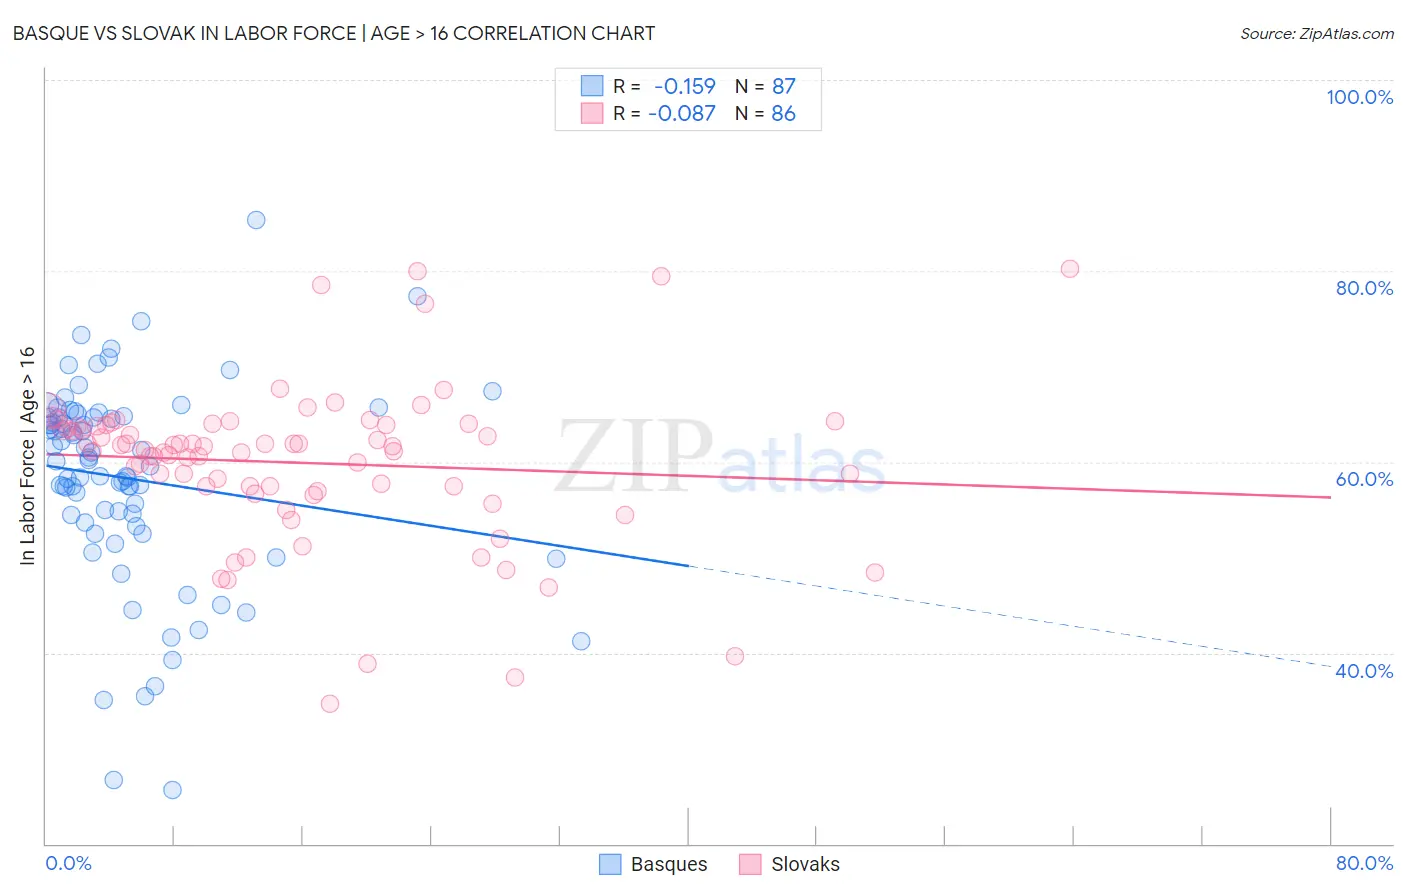
Basque vs Slovak In Labor Force | Age > 16 Correlation Chart
The statistical analysis conducted on geographies consisting of 165,779,743 people shows a poor negative correlation between the proportion of Basques and labor force participation rate among population ages 16 and over in the United States with a correlation coefficient (R) of -0.159 and weighted average of 64.2%. Similarly, the statistical analysis conducted on geographies consisting of 397,893,626 people shows a slight negative correlation between the proportion of Slovaks and labor force participation rate among population ages 16 and over in the United States with a correlation coefficient (R) of -0.087 and weighted average of 63.9%, a difference of 0.50%.
In Labor Force | Age > 16 Correlation Summary
| Measurement | Basque | Slovak |
| Minimum | 25.7% | 34.7% |
| Maximum | 85.4% | 80.2% |
| Range | 59.7% | 45.5% |
| Mean | 58.2% | 59.9% |
| Median | 60.1% | 61.4% |
| Interquartile 25% (IQ1) | 53.6% | 57.4% |
| Interquartile 75% (IQ3) | 64.7% | 63.8% |
| Interquartile Range (IQR) | 11.1% | 6.4% |
| Standard Deviation (Sample) | 10.6% | 8.2% |
| Standard Deviation (Population) | 10.5% | 8.2% |
Similar Demographics by In Labor Force | Age > 16
Demographics Similar to Basques by In Labor Force | Age > 16
In terms of in labor force | age > 16, the demographic groups most similar to Basques are Marshallese (64.2%, a difference of 0.0%), Immigrants from Western Europe (64.2%, a difference of 0.010%), Finnish (64.2%, a difference of 0.010%), Bahamian (64.2%, a difference of 0.030%), and Immigrants from Scotland (64.2%, a difference of 0.040%).
| Demographics | Rating | Rank | In Labor Force | Age > 16 |
| Immigrants | Uzbekistan | 1.4 /100 | #254 | Tragic 64.3% |
| Hispanics or Latinos | 1.1 /100 | #255 | Tragic 64.3% |
| Immigrants | Mexico | 1.0 /100 | #256 | Tragic 64.3% |
| Inupiat | 0.8 /100 | #257 | Tragic 64.3% |
| Immigrants | Scotland | 0.8 /100 | #258 | Tragic 64.2% |
| Immigrants | Western Europe | 0.7 /100 | #259 | Tragic 64.2% |
| Marshallese | 0.7 /100 | #260 | Tragic 64.2% |
| Basques | 0.7 /100 | #261 | Tragic 64.2% |
| Finns | 0.7 /100 | #262 | Tragic 64.2% |
| Bahamians | 0.6 /100 | #263 | Tragic 64.2% |
| Dutch | 0.6 /100 | #264 | Tragic 64.2% |
| Cubans | 0.5 /100 | #265 | Tragic 64.2% |
| Immigrants | England | 0.5 /100 | #266 | Tragic 64.2% |
| Canadians | 0.5 /100 | #267 | Tragic 64.1% |
| Spaniards | 0.5 /100 | #268 | Tragic 64.1% |
Demographics Similar to Slovaks by In Labor Force | Age > 16
In terms of in labor force | age > 16, the demographic groups most similar to Slovaks are French (63.9%, a difference of 0.030%), Immigrants from Austria (63.9%, a difference of 0.030%), Scottish (63.9%, a difference of 0.030%), Immigrants from Germany (63.9%, a difference of 0.040%), and Spanish (63.9%, a difference of 0.070%).
| Demographics | Rating | Rank | In Labor Force | Age > 16 |
| Assyrians/Chaldeans/Syriacs | 0.3 /100 | #278 | Tragic 64.0% |
| Welsh | 0.2 /100 | #279 | Tragic 64.0% |
| Immigrants | St. Vincent and the Grenadines | 0.2 /100 | #280 | Tragic 64.0% |
| French Canadians | 0.2 /100 | #281 | Tragic 64.0% |
| Immigrants | Guyana | 0.2 /100 | #282 | Tragic 64.0% |
| Immigrants | Germany | 0.1 /100 | #283 | Tragic 63.9% |
| French | 0.1 /100 | #284 | Tragic 63.9% |
| Slovaks | 0.1 /100 | #285 | Tragic 63.9% |
| Immigrants | Austria | 0.1 /100 | #286 | Tragic 63.9% |
| Scottish | 0.1 /100 | #287 | Tragic 63.9% |
| Spanish | 0.1 /100 | #288 | Tragic 63.9% |
| Celtics | 0.1 /100 | #289 | Tragic 63.8% |
| Hungarians | 0.1 /100 | #290 | Tragic 63.8% |
| Nepalese | 0.1 /100 | #291 | Tragic 63.8% |
| Spanish American Indians | 0.1 /100 | #292 | Tragic 63.8% |