Scotch-Irish vs Immigrants from Serbia In Labor Force | Age 20-64
COMPARE
Scotch-Irish
Immigrants from Serbia
In Labor Force | Age 20-64
In Labor Force | Age 20-64 Comparison
Scotch-Irish
Immigrants from Serbia
78.3%
IN LABOR FORCE | AGE 20-64
0.0/ 100
METRIC RATING
270th/ 347
METRIC RANK
80.8%
IN LABOR FORCE | AGE 20-64
100.0/ 100
METRIC RATING
26th/ 347
METRIC RANK
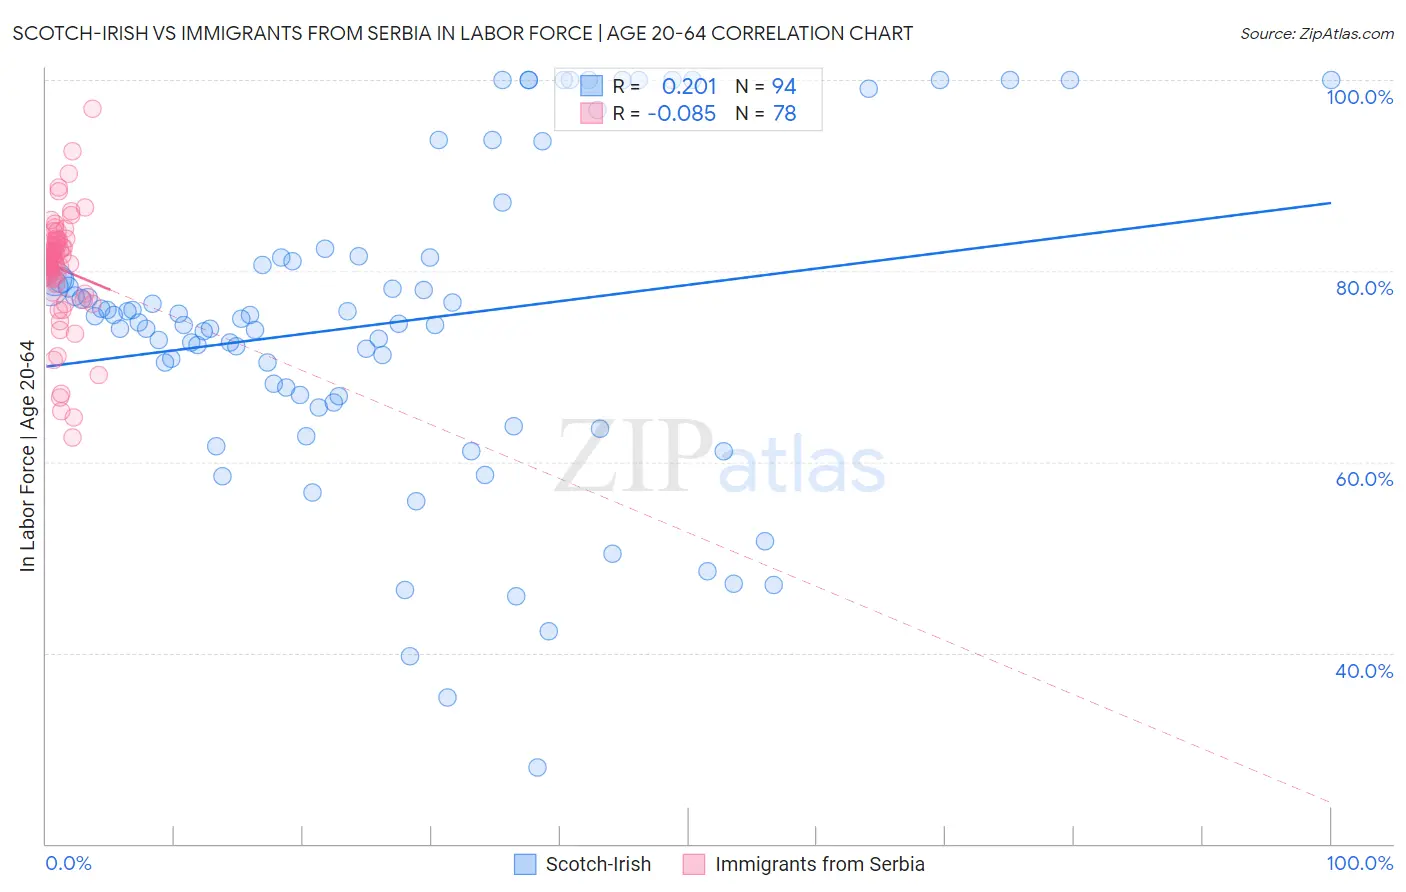
Scotch-Irish vs Immigrants from Serbia In Labor Force | Age 20-64 Correlation Chart
The statistical analysis conducted on geographies consisting of 548,766,362 people shows a weak positive correlation between the proportion of Scotch-Irish and labor force participation rate among population between the ages 20 and 64 in the United States with a correlation coefficient (R) of 0.201 and weighted average of 78.3%. Similarly, the statistical analysis conducted on geographies consisting of 131,747,619 people shows a slight negative correlation between the proportion of Immigrants from Serbia and labor force participation rate among population between the ages 20 and 64 in the United States with a correlation coefficient (R) of -0.085 and weighted average of 80.8%, a difference of 3.2%.
In Labor Force | Age 20-64 Correlation Summary
| Measurement | Scotch-Irish | Immigrants from Serbia |
| Minimum | 28.0% | 62.6% |
| Maximum | 100.0% | 97.0% |
| Range | 72.0% | 34.4% |
| Mean | 74.6% | 80.3% |
| Median | 74.8% | 81.1% |
| Interquartile 25% (IQ1) | 66.9% | 79.2% |
| Interquartile 75% (IQ3) | 81.3% | 83.1% |
| Interquartile Range (IQR) | 14.5% | 3.8% |
| Standard Deviation (Sample) | 16.5% | 5.9% |
| Standard Deviation (Population) | 16.4% | 5.8% |
Similar Demographics by In Labor Force | Age 20-64
Demographics Similar to Scotch-Irish by In Labor Force | Age 20-64
In terms of in labor force | age 20-64, the demographic groups most similar to Scotch-Irish are Immigrants from Barbados (78.3%, a difference of 0.020%), Immigrants from Latin America (78.3%, a difference of 0.020%), Marshallese (78.3%, a difference of 0.020%), French American Indian (78.2%, a difference of 0.070%), and West Indian (78.3%, a difference of 0.080%).
| Demographics | Rating | Rank | In Labor Force | Age 20-64 |
| Pennsylvania Germans | 0.1 /100 | #263 | Tragic 78.4% |
| Spaniards | 0.1 /100 | #264 | Tragic 78.4% |
| British West Indians | 0.1 /100 | #265 | Tragic 78.4% |
| Bahamians | 0.1 /100 | #266 | Tragic 78.4% |
| U.S. Virgin Islanders | 0.1 /100 | #267 | Tragic 78.4% |
| West Indians | 0.0 /100 | #268 | Tragic 78.3% |
| Immigrants | Barbados | 0.0 /100 | #269 | Tragic 78.3% |
| Scotch-Irish | 0.0 /100 | #270 | Tragic 78.3% |
| Immigrants | Latin America | 0.0 /100 | #271 | Tragic 78.3% |
| Marshallese | 0.0 /100 | #272 | Tragic 78.3% |
| French American Indians | 0.0 /100 | #273 | Tragic 78.2% |
| Aleuts | 0.0 /100 | #274 | Tragic 78.2% |
| Spanish | 0.0 /100 | #275 | Tragic 78.2% |
| Puget Sound Salish | 0.0 /100 | #276 | Tragic 78.2% |
| Immigrants | Bahamas | 0.0 /100 | #277 | Tragic 78.2% |
Demographics Similar to Immigrants from Serbia by In Labor Force | Age 20-64
In terms of in labor force | age 20-64, the demographic groups most similar to Immigrants from Serbia are Kenyan (80.8%, a difference of 0.020%), Immigrants from Morocco (80.8%, a difference of 0.030%), Immigrants from Bosnia and Herzegovina (80.8%, a difference of 0.040%), Sudanese (80.8%, a difference of 0.050%), and Immigrants from Kenya (80.7%, a difference of 0.070%).
| Demographics | Rating | Rank | In Labor Force | Age 20-64 |
| Zimbabweans | 100.0 /100 | #19 | Exceptional 81.0% |
| Thais | 100.0 /100 | #20 | Exceptional 80.9% |
| Liberians | 100.0 /100 | #21 | Exceptional 80.9% |
| Sudanese | 100.0 /100 | #22 | Exceptional 80.8% |
| Immigrants | Bosnia and Herzegovina | 100.0 /100 | #23 | Exceptional 80.8% |
| Immigrants | Morocco | 100.0 /100 | #24 | Exceptional 80.8% |
| Kenyans | 100.0 /100 | #25 | Exceptional 80.8% |
| Immigrants | Serbia | 100.0 /100 | #26 | Exceptional 80.8% |
| Immigrants | Kenya | 99.9 /100 | #27 | Exceptional 80.7% |
| Immigrants | Uganda | 99.9 /100 | #28 | Exceptional 80.7% |
| Immigrants | South Central Asia | 99.9 /100 | #29 | Exceptional 80.7% |
| Immigrants | North Macedonia | 99.9 /100 | #30 | Exceptional 80.7% |
| Immigrants | Lithuania | 99.9 /100 | #31 | Exceptional 80.7% |
| Immigrants | Ireland | 99.9 /100 | #32 | Exceptional 80.7% |
| Chinese | 99.9 /100 | #33 | Exceptional 80.7% |