South American Indian vs Immigrants from Haiti In Labor Force | Age > 16
COMPARE
South American Indian
Immigrants from Haiti
In Labor Force | Age > 16
In Labor Force | Age > 16 Comparison
South American Indians
Immigrants from Haiti
66.0%
IN LABOR FORCE | AGE > 16
99.4/ 100
METRIC RATING
87th/ 347
METRIC RANK
65.1%
IN LABOR FORCE | AGE > 16
43.3/ 100
METRIC RATING
179th/ 347
METRIC RANK
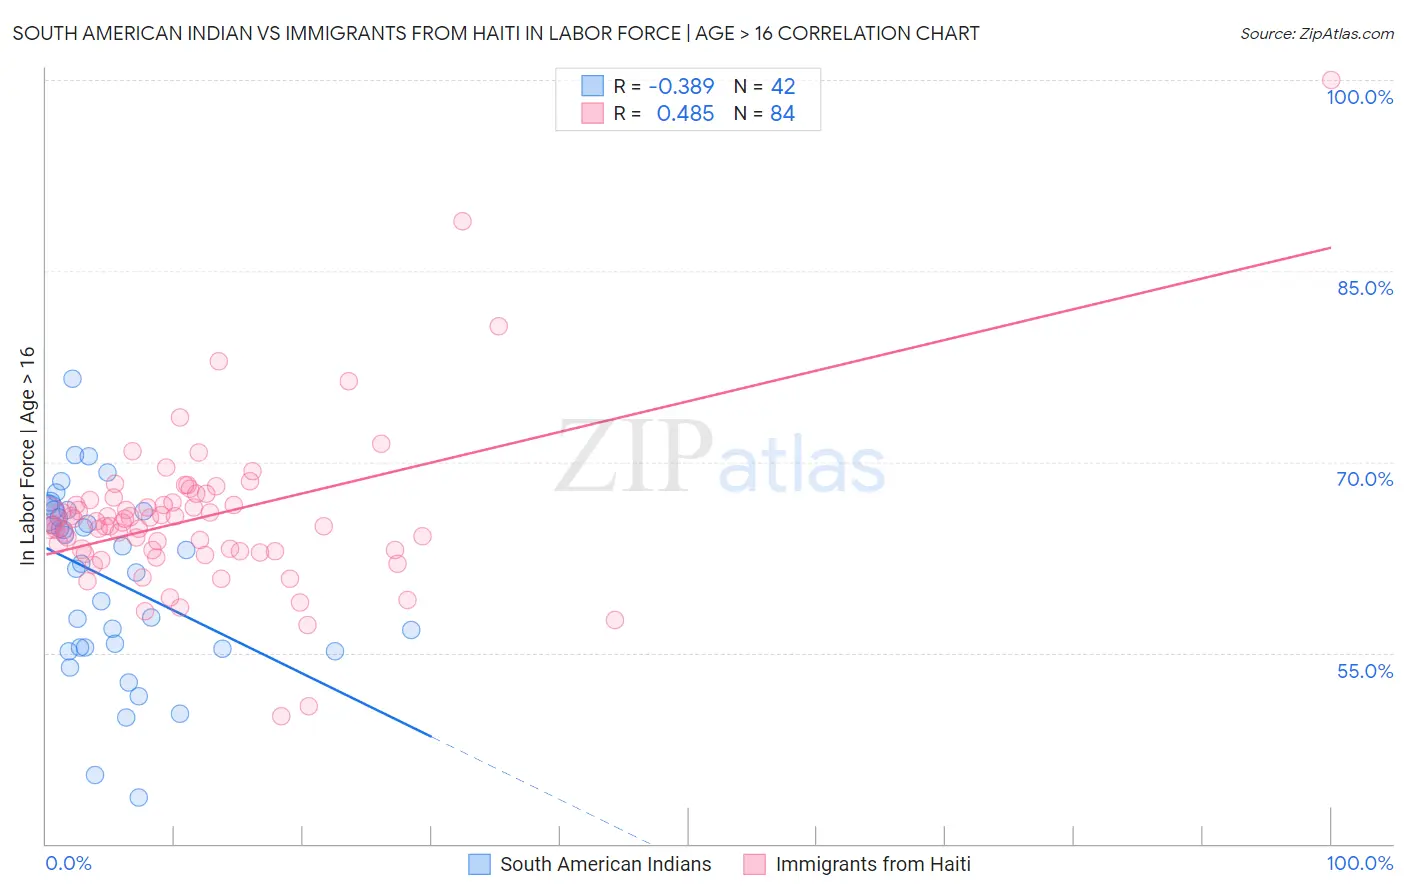
South American Indian vs Immigrants from Haiti In Labor Force | Age > 16 Correlation Chart
The statistical analysis conducted on geographies consisting of 164,562,228 people shows a mild negative correlation between the proportion of South American Indians and labor force participation rate among population ages 16 and over in the United States with a correlation coefficient (R) of -0.389 and weighted average of 66.0%. Similarly, the statistical analysis conducted on geographies consisting of 225,285,976 people shows a moderate positive correlation between the proportion of Immigrants from Haiti and labor force participation rate among population ages 16 and over in the United States with a correlation coefficient (R) of 0.485 and weighted average of 65.1%, a difference of 1.5%.
In Labor Force | Age > 16 Correlation Summary
| Measurement | South American Indian | Immigrants from Haiti |
| Minimum | 43.6% | 50.0% |
| Maximum | 76.5% | 100.0% |
| Range | 32.9% | 50.0% |
| Mean | 60.8% | 65.6% |
| Median | 62.6% | 65.1% |
| Interquartile 25% (IQ1) | 55.4% | 63.0% |
| Interquartile 75% (IQ3) | 66.1% | 66.9% |
| Interquartile Range (IQR) | 10.7% | 3.9% |
| Standard Deviation (Sample) | 7.2% | 6.5% |
| Standard Deviation (Population) | 7.1% | 6.5% |
Similar Demographics by In Labor Force | Age > 16
Demographics Similar to South American Indians by In Labor Force | Age > 16
In terms of in labor force | age > 16, the demographic groups most similar to South American Indians are Bermudan (66.0%, a difference of 0.0%), South American (66.0%, a difference of 0.010%), Mongolian (66.1%, a difference of 0.020%), German Russian (66.1%, a difference of 0.040%), and Immigrants from Jordan (66.1%, a difference of 0.040%).
| Demographics | Rating | Rank | In Labor Force | Age > 16 |
| Malaysians | 99.6 /100 | #80 | Exceptional 66.1% |
| Moroccans | 99.5 /100 | #81 | Exceptional 66.1% |
| German Russians | 99.4 /100 | #82 | Exceptional 66.1% |
| Immigrants | Jordan | 99.4 /100 | #83 | Exceptional 66.1% |
| Central Americans | 99.4 /100 | #84 | Exceptional 66.1% |
| Mongolians | 99.4 /100 | #85 | Exceptional 66.1% |
| South Americans | 99.4 /100 | #86 | Exceptional 66.0% |
| South American Indians | 99.4 /100 | #87 | Exceptional 66.0% |
| Bermudans | 99.3 /100 | #88 | Exceptional 66.0% |
| Immigrants | Laos | 99.2 /100 | #89 | Exceptional 66.0% |
| Chileans | 99.2 /100 | #90 | Exceptional 66.0% |
| Iranians | 99.2 /100 | #91 | Exceptional 66.0% |
| Aleuts | 99.1 /100 | #92 | Exceptional 66.0% |
| Immigrants | South America | 99.1 /100 | #93 | Exceptional 66.0% |
| Immigrants | Cambodia | 99.1 /100 | #94 | Exceptional 66.0% |
Demographics Similar to Immigrants from Haiti by In Labor Force | Age > 16
In terms of in labor force | age > 16, the demographic groups most similar to Immigrants from Haiti are Immigrants from Latvia (65.1%, a difference of 0.0%), Immigrants from Panama (65.1%, a difference of 0.010%), Trinidadian and Tobagonian (65.1%, a difference of 0.020%), Eastern European (65.1%, a difference of 0.030%), and Immigrants from Nicaragua (65.1%, a difference of 0.030%).
| Demographics | Rating | Rank | In Labor Force | Age > 16 |
| Immigrants | Sweden | 61.3 /100 | #172 | Good 65.2% |
| Immigrants | Ukraine | 53.7 /100 | #173 | Average 65.1% |
| Macedonians | 50.0 /100 | #174 | Average 65.1% |
| Nicaraguans | 49.7 /100 | #175 | Average 65.1% |
| Swedes | 47.4 /100 | #176 | Average 65.1% |
| Eastern Europeans | 46.2 /100 | #177 | Average 65.1% |
| Trinidadians and Tobagonians | 45.2 /100 | #178 | Average 65.1% |
| Immigrants | Haiti | 43.3 /100 | #179 | Average 65.1% |
| Immigrants | Latvia | 42.9 /100 | #180 | Average 65.1% |
| Immigrants | Panama | 42.4 /100 | #181 | Average 65.1% |
| Immigrants | Nicaragua | 41.1 /100 | #182 | Average 65.1% |
| Soviet Union | 40.5 /100 | #183 | Average 65.0% |
| Carpatho Rusyns | 40.0 /100 | #184 | Average 65.0% |
| Syrians | 40.0 /100 | #185 | Average 65.0% |
| Immigrants | Switzerland | 38.2 /100 | #186 | Fair 65.0% |