Scandinavian vs Sioux In Labor Force | Age 16-19
COMPARE
Scandinavian
Sioux
In Labor Force | Age 16-19
In Labor Force | Age 16-19 Comparison
Scandinavians
Sioux
43.6%
IN LABOR FORCE | AGE 16-19
100.0/ 100
METRIC RATING
17th/ 347
METRIC RANK
41.5%
IN LABOR FORCE | AGE 16-19
100.0/ 100
METRIC RATING
38th/ 347
METRIC RANK
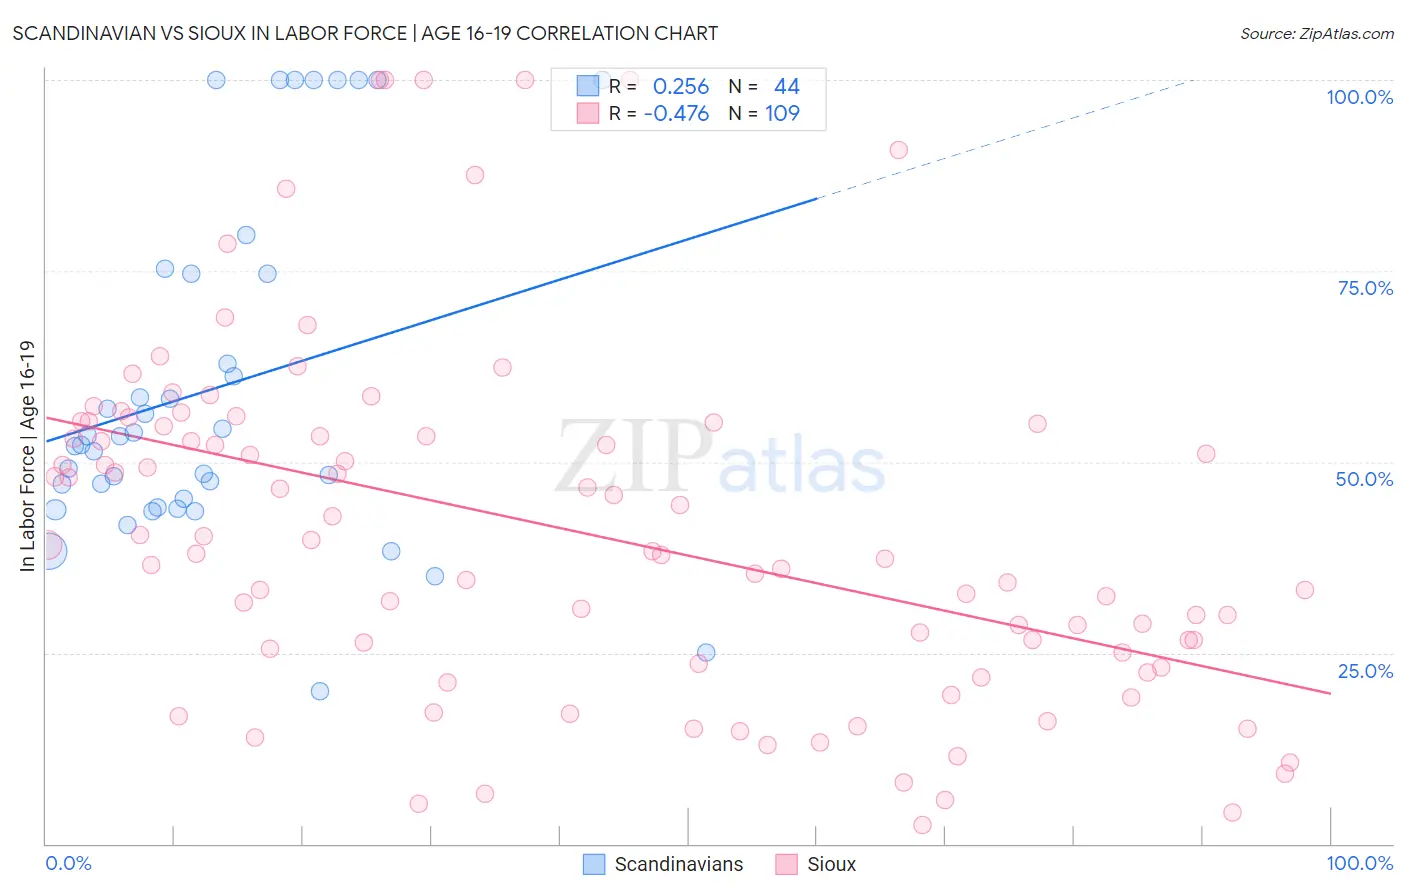
Scandinavian vs Sioux In Labor Force | Age 16-19 Correlation Chart
The statistical analysis conducted on geographies consisting of 471,147,409 people shows a weak positive correlation between the proportion of Scandinavians and labor force participation rate among population between the ages 16 and 19 in the United States with a correlation coefficient (R) of 0.256 and weighted average of 43.6%. Similarly, the statistical analysis conducted on geographies consisting of 233,888,038 people shows a moderate negative correlation between the proportion of Sioux and labor force participation rate among population between the ages 16 and 19 in the United States with a correlation coefficient (R) of -0.476 and weighted average of 41.5%, a difference of 5.0%.
In Labor Force | Age 16-19 Correlation Summary
| Measurement | Scandinavian | Sioux |
| Minimum | 20.0% | 2.4% |
| Maximum | 100.0% | 100.0% |
| Range | 80.0% | 97.6% |
| Mean | 59.7% | 41.1% |
| Median | 52.8% | 38.3% |
| Interquartile 25% (IQ1) | 44.6% | 24.2% |
| Interquartile 75% (IQ3) | 74.6% | 54.9% |
| Interquartile Range (IQR) | 30.0% | 30.6% |
| Standard Deviation (Sample) | 22.4% | 23.0% |
| Standard Deviation (Population) | 22.1% | 22.9% |
Similar Demographics by In Labor Force | Age 16-19
Demographics Similar to Scandinavians by In Labor Force | Age 16-19
In terms of in labor force | age 16-19, the demographic groups most similar to Scandinavians are Czech (43.6%, a difference of 0.070%), French Canadian (43.6%, a difference of 0.070%), Slovene (43.7%, a difference of 0.17%), Chippewa (43.8%, a difference of 0.43%), and Dutch (43.8%, a difference of 0.53%).
| Demographics | Rating | Rank | In Labor Force | Age 16-19 |
| Germans | 100.0 /100 | #10 | Exceptional 44.2% |
| Swedes | 100.0 /100 | #11 | Exceptional 44.1% |
| Finns | 100.0 /100 | #12 | Exceptional 43.9% |
| Dutch | 100.0 /100 | #13 | Exceptional 43.8% |
| Chippewa | 100.0 /100 | #14 | Exceptional 43.8% |
| Slovenes | 100.0 /100 | #15 | Exceptional 43.7% |
| Czechs | 100.0 /100 | #16 | Exceptional 43.6% |
| Scandinavians | 100.0 /100 | #17 | Exceptional 43.6% |
| French Canadians | 100.0 /100 | #18 | Exceptional 43.6% |
| Belgians | 100.0 /100 | #19 | Exceptional 43.4% |
| Swiss | 100.0 /100 | #20 | Exceptional 43.3% |
| Ottawa | 100.0 /100 | #21 | Exceptional 43.0% |
| Sudanese | 100.0 /100 | #22 | Exceptional 42.9% |
| Slovaks | 100.0 /100 | #23 | Exceptional 42.6% |
| Bangladeshis | 100.0 /100 | #24 | Exceptional 42.5% |
Demographics Similar to Sioux by In Labor Force | Age 16-19
In terms of in labor force | age 16-19, the demographic groups most similar to Sioux are Scotch-Irish (41.5%, a difference of 0.14%), Immigrants from Liberia (41.5%, a difference of 0.23%), Immigrants from Congo (41.7%, a difference of 0.35%), Immigrants from the Azores (41.7%, a difference of 0.42%), and Yugoslavian (41.8%, a difference of 0.57%).
| Demographics | Rating | Rank | In Labor Force | Age 16-19 |
| Irish | 100.0 /100 | #31 | Exceptional 42.0% |
| Czechoslovakians | 100.0 /100 | #32 | Exceptional 41.9% |
| Liberians | 100.0 /100 | #33 | Exceptional 41.8% |
| Immigrants | Bosnia and Herzegovina | 100.0 /100 | #34 | Exceptional 41.8% |
| Yugoslavians | 100.0 /100 | #35 | Exceptional 41.8% |
| Immigrants | Azores | 100.0 /100 | #36 | Exceptional 41.7% |
| Immigrants | Congo | 100.0 /100 | #37 | Exceptional 41.7% |
| Sioux | 100.0 /100 | #38 | Exceptional 41.5% |
| Scotch-Irish | 100.0 /100 | #39 | Exceptional 41.5% |
| Immigrants | Liberia | 100.0 /100 | #40 | Exceptional 41.5% |
| Celtics | 100.0 /100 | #41 | Exceptional 41.3% |
| Whites/Caucasians | 100.0 /100 | #42 | Exceptional 41.3% |
| Tongans | 100.0 /100 | #43 | Exceptional 41.2% |
| Europeans | 100.0 /100 | #44 | Exceptional 41.1% |
| Croatians | 100.0 /100 | #45 | Exceptional 41.1% |